I. Introduction
This project is intended to demonstrate the applicability of crop mapping procedures used in the Lower Colorado River Basin for classifying crop types in the Central Valley of California. These procedures have achieved overall accuracies of approximately 93% (Congalton, et. al., 1998). The project also provides for technology transfer between the Mid-Pacific and the Lower Colorado Regions of the Bureau of Reclamation (BOR), and the California Department of Water Resources (CADWR).
Crop data and water use information is required for water contracts under the Central Valley Project Improvement Act (CVPIA) (Figure 1). Remote sensing and GIS can offer cost-effective means of providing more frequent crop/land cover data for short and long term planning. Two pilot areas in the Central Valley were identified for this project: Kings County and Yolo County (Figure 2). This paper summarizes the results of the Kings County classification. Yolo County work is presently being completed. Kings County, California is one of the largest crop producing counties in California. Some of the main crops grown here include tomatoes, cotton, safflower, corn, grain, alfalfa and rice. Of the 890,000 acres covered by Kings County, 600,000 acres are used for agriculture and 550,000 acres of that is used for field or vegetable crops (Figure 3) (CADWR, 1996).
Current methods of surveying agricultural lands in California
State agencies such as CADWR have the responsibility of mapping agricultural lands and crops for inventory mapping and analysis. CADWR conducts land use surveys by county, visiting 100% of cropped lands through extensive fieldwork. CADWR re-surveys each county approximately every 5 years within their Detail Analysis Units (DAU). As a result, county crop data is not always current and does not always reflect the full crop rotations for a given year or season. Typically, the Central Valley has two major crop planting cycles per year: one for summer crops and one for winter crops. This demonstration project utilizes existing CADWR land use survey data to determine the effectiveness and accuracy of crop classification methods used for LCRAS.
LCRAS methodology
The method used for this project is a method currently being used in the Lower Colorado Region of the BOR to identify crops for the primary purpose of calculating water consumption. The Lower Colorado River Accounting System (LCRAS) is an accounting method that estimates and distributes consumptive use to diverters along the lower Colorado River basin. LCRAS uses a water balance equation in which all the inflows, outflows, and water uses are calculated or estimated. The residual of this water balance reflects errors of estimate in all inflows, outflows, and water uses (U.S.D.I. Bureau of Reclamation, 1997). Accurate crop identification is an essential part of this process, since the evapotranspiration and acreage parameters in these equations are influential factors that vary by vegetation type.
Remote sensing and GIS processes are used to identify and map the vegetation class in LCRAS. The procedure utilizes Landsat Thematic Mapper satellite imagery purchased for dates that coincide with mature crop conditions for crop rotation cycles in the region. Ground reference data is collected for approximately 15% of the agricultural fields coincident with the date of the satellite imagery. Different crops, depending upon maturity, crop condition, and moisture reflect energy in the electromagnetic spectrum differently. Landsat TM imagery "registers" the amount of energy reflected in seven discrete intervals (bands) within the electromagnetic spectrum. This data can be used with the 15% ground reference data to identify or "classify" the crops that were not surveyed in the field. If effective, only a representative percentage of all crop conditions need to be collected in order to classify the entire agricultural region.
Imagery
For this demonstration, ground reference data collected by CADWR in the summer of 1996 was utilized in order to alleviate the need to collect additional field data. Satellite imagery was purchased from the USGS EROS Data Center to correspond as closely as possible with the 1996 field data collection dates. Because CADWR does not collect ground reference data for remote sensing procedures, crop-planting practices were also considered so that an image date containing as many mature crops as possible could be purchased. Knowledge of variability in planting and harvesting times for each crop is critical in the selection of image and field-data collection dates during the year as spectrally unique "signatures" for crop classification are often dependent on the amount of vegetation cover. Crop calendars for Kings County were obtained to aid in choosing the best image dates. Ground reference data is required to understand unique relationships between the spectral signatures derived from the image data and crop types/conditions on the ground. However, CADWR ground reference data did not include crop condition (maturity, growth stage or the extent of vegetative ground cover) information so crop maturity was inferred from the amount of infrared reflectance in the image. This project focused on identifying only mature crop conditions.
Landsat TM data acquired for this analysis was a July 8, 1996 scene, Path 42, Row 35 (World Reference System). Other considerations in image selection included percentage of cloud cover and overall quality of data. All satellite data and GIS coverages were projected into UTM Zone 10 (meters), NAD 27 datum with Clarke 1866 spheroid projection.
Field Border Database
For this project, we used the existing 1996 CADWR land use field border database attributed with crop types based on the 1996 CADWR survey (>11,000 fields). An example of a GIS field boundary database over Landsat TM imagery is presented in Figure 4. The data was converted from DXF into an Arc/Info polygon field border coverage.
Classification
LCRAS methods sample approximately 15% of the Lower Colorado Region agricultural fields to successfully identify crop types for the entire region. For this demonstration project, however, we had 100% of Kings County ground reference data from the 1996 CADWR survey. Therefore, we simulated future sampling requirements by selecting a subset of the CADWR data to represent a 15% ground reference sample. We first selected mature crops, as a remote-sensing-based survey would utilize images coincident with mature crop conditions. In this instance, "mature" generally refers to crops that have a vegetative crown closure of greater than 20% to 30% (dependent on the nature of the crop). To determine immature versus mature crops, an unsupervised classification with 30 classes or clusters was run and analyzed to determine which fields were too immature (or fallow) to be tested with this procedure. An item called "Mature" was then added to the GIS field-border database and attributed as shown below:
0 – Minimal infrared response (immature or senescent crop, fallow)
1 – Irrigated crop (flooded, water)
2 – Dark agriculture (very wet mature crop)
3 – Medium to high infrared response (mature crop)
4 – Anomalous spectral response (probably mature crop- unusual spectral response).
Some Mature = 0 crop fields were included to generate signatures for fallow fields.
Next, an Arc Macro Language (AML) was used to complete a random stratified sample of approximately 15% of the crop fields based on crop type and the "Mature" attribute, for use as ground reference fields in the image classification process. This AML was also used to select (also random stratified) approximately 30 to 40% of the 15% sample to be reserved for an independent accuracy assessment (procedure used in LCRAS). The ground reference fields selected for image classification purposes were then buffered(inside) and used to mask the satellite imagery. Region growing algorithms (Woodcock, 1992) were then used to automatically generate spectral "regions" within the masked imagery for use in generating spectral signatures for the image classification process. These regions capture all within field spectral variation (Figures 5 and 6). Various region-growing parameters were tested to generate a reasonable signature set. These spectral regions were then converted to an ARC vector coverage and related back to the field border coverage database containing the crop type information. Spectral signatures were then automatically generated (from the spectral regions) in ERDAS using the ARC vector coverage as an Area of Interest (AOI) file (Figure 7). For further details on these processes see U.S.D.I. Bureau of Reclamation, 1997.
All unsupervised and supervised classifications were run in ERDAS Imagine 8.3 software. There were several evaluation and edit iterations of the generated signature file. The signature set was refined by including only those signatures with a pixel count of 12 or higher, a standard deviation of less than or equal to 5.0 in all bands, and by visual inspection. Standard deviation cutoffs for optimal results may vary as a function of crop variability at the time of classification. Orchards, vineyards, semi-agricultural farmsteads and any other non-agricultural areas were not included in the training set signature files. Table 1 (Appendix) presents the crop classes sampled and used as input for the classification.
Signatures are automatically labeled in the ERDAS signature cell array from the Arc vector coverage (signature regions) cell array using ERDAS 8.3. Signature names were alphanumeric to include the field-id, the maturity value and the crop type for each signature region. Supervised classifications were then run on the training data set using a maximum likelihood classifier (ERDAS, 1997). Per pixel crop classifications were then summarized by field borders using the pixel classification and the field border coverage. The field received a crop label based on a plurality rule (i.e.- what most of the pixels within the field were classified as). This step often results in improved accuracies, as a given percentage of "noise" or error is commonly present within the classification at the pixel level.
After the classification was run, a crop "item" populated with the resulting classified crop code (crop label for the field) was joined to the field border coverage database.
Accuracy Assessment
A standard error matrix (Congalton, 1991) was constructed using the CADWR ground reference fields (not those reserved for accuracy assessment), to obtain an initial indication of accuracy. This information was used to refine the signature set (if needed) for a second iteration. Additional supervised classifications were then run and new error matrix tables were generated (Appendix – Table 2). Once an acceptable level of accuracy was reached, the independent fields reserved for accuracy assessment were utilized for a final accuracy matrix. Accuracies are reported based on acres of crops classed correctly.
III. Results
Three supervised classification iterations were completed. The overall accuracy was greater than 90% (Appendix – Table 2) in the first supervised classification. The results suggest that the greatest amount of error in the classifier is in small or low acreage fields. The mixed pixels caused by mixed conditions (i.e. road and crop) within a single pixel at the outer boundaries of the small fields may have resulted in field being mislabeled as these misclassed pixels will carry more weight in a small field with respect to the field labeling rules.
Constraints
Field Border Database
The project relied solely on the 1996 CADWR database; no additional field data was collected specifically for this project. Although this approach was a cost-effective means of testing the procedure, it created some limitations on the data analysis.
Although the imagery was purchased to match the mature stages of important crops, the field data collection time was not necessarily tied to crop maturity or spectral considerations. This is evident in the wide spectral variation observed in signatures for cotton and grains. More than one field data collection period and image classification may be required to reflect crop rotations. Additionally, the field labeling methodology assumes one crop type per field but in some instances the existing field border database showed a single field (polygon) that actually had more than one crop type present. These field borders would require additional boundaries to be added to reflect the multiple crop condition. Lastly, the absence of crop conditions or growth stage information in the CADWR field database makes some observed error difficult to explain.
Cotton Fields
Cotton represents the greatest crop acreage in Kings County. The classification correctly classed 99% of all cotton (Appendix -Table 2). However, cotton signatures were also responsible for the greatest errors of commission. This was probably due to the large amount of spectral variability within cotton fields (due to either defoliation from applied defoliant or salt stress). Signatures in these fields ranged from high infrared reflectance to fallow-like areas in a single field. An image date prior to defoliation may have alleviated some error caused by this relationship.
Frequency of Other Crops
Because there was inadequate signature representation of certain low frequency crops after the signature set was refined (e.g. sugar beets, Sudan grass, and asparagus), signatures for these types were manually generated. Other fields were too small in area to generate adequate signatures (e.g. melons and squash) but these types also have a very low relative acreage so do not represent significant error in final product.
IV. Conclusions
Considering the constraints of using field data not collected specifically for this methodology, and the possible discrepancy between field data collection dates and the purchased imagery, the classification results were still very good. Results indicate that greater than 90% classification accuracy can be expected using this methodology, sampling only about 15% of the agricultural fields. This methodology should prove useful in generating more frequent, cost-effective land use information.
Presently, the BOR is investigating coordination with other land cover mapping programs in the State of California (U.S.Forest Service / California Department of Fire and Forestry Protection Statewide Change Detection Program , California Department of Fish and Game Wetlands Mapping Program, and California Department Of Conservation Farmland Mapping Program). These types of cooperative initiatives are integral to providing timely data for short and long-range planning, developing standardized databases, reducing costs and redundancy in existing programs, and sharing technology between State and Federal agencies.
Acknowledgements
The authors would like to thank the Lower Colorado and Mid Pacific Regions of the Bureau of Reclamation and Tom Hawkins and Austine Eke of the California Department of Water Resources for support of this project.
|
Crop |
DWR Usage Code |
|
Alfalfa Pasture |
P1 |
|
Alfalfa Seed Crop |
P1-S |
|
Asparagus Seed |
T2-S |
|
Cole Crops |
T4 |
|
Corn |
F6 |
|
Corn/Cole Crop |
F6/t4 |
|
Cotton |
F1 |
|
Dry beans |
F10 |
|
Fallow |
F-F |
|
Grain and Hay |
G |
|
Grain/Broccoli |
G/t22 |
|
Grain/Corn |
G/F6 |
|
Melons, Squash, Cucumber |
T9 |
|
Melons/Cole Crop |
T9/t4 |
|
Melons/Dry beans |
T9/F10 |
|
Miscellaneous Field Crop |
F11 |
|
Mixed Pasture |
P3 |
|
Onions-Garlic |
T10 |
|
Safflower |
F2 |
|
Sudan |
F8 |
|
Sugar Beets |
F5 |
|
Sweet Potatoes |
T13 |
|
Tomatoes |
T15 |
|
Sum of ACRES |
USAGE |
||||||||||||||||||||||||
|
CROP-LABEL |
F1 |
F10 |
F11 |
F2 |
F5 |
F6 |
F6/t4 |
F8 |
F-F |
G |
G/F6 |
G/t22 |
P1 |
P1-S |
P3 |
T10 |
T13 |
T15 |
T2-S |
T4 |
T9 |
T9/F10 |
T9/t4 |
Grand Total |
& error of commission |
|
F1 - Cotton |
30801.03 |
8.30 |
1218.34 |
31.63 |
104.28 |
27.97 |
51.69 |
35.88 |
846.00 |
179.90 |
274.29 |
71.86 |
101.22 |
44.97 |
14.14 |
152.12 |
184.74 |
4.94 |
51.00 |
34204.30 |
90.05 |
||||
|
F10 - Dry beans |
0.00 |
0.00 |
0.00 |
||||||||||||||||||||||
|
F11 - Misc. Fld. Crp. |
226.94 |
226.94 |
100.00 |
||||||||||||||||||||||
|
F2 - Safflower |
3420.97 |
124.15 |
3545.12 |
96.50 |
|||||||||||||||||||||
|
F5 - Sugar Beets |
102.70 |
102.70 |
100.00 |
||||||||||||||||||||||
|
F6 - Corn |
28.76 |
3972.92 |
240.78 |
91.83 |
118.32 |
7.71 |
4460.32 |
89.07 |
|||||||||||||||||
|
F6/t4 - Corn/Cole Crp. |
0.00 |
0.00 |
0.00 |
||||||||||||||||||||||
|
F8 - Sudan |
79.57 |
79.57 |
100.00 |
||||||||||||||||||||||
|
F-F - Fallow |
51.89 |
1380.05 |
273.80 |
1705.74 |
80.91 |
||||||||||||||||||||
|
G - Grain and Hay |
6.72 |
233.67 |
124.05 |
6830.68 |
10.38 |
7205.49 |
94.80 |
||||||||||||||||||
|
G/F6 - Grain/Corn |
0.00 |
0.00 |
0.00 |
||||||||||||||||||||||
|
G/t22 - Grain/Broccoli |
18.98 |
24.32 |
249.68 |
292.97 |
85.22 |
||||||||||||||||||||
|
P1 - Alfalfa Pasture |
39.54 |
59.21 |
1257.09 |
1355.84 |
92.72 |
||||||||||||||||||||
|
P1-S - Alfalfa Seed Crp. |
146.98 |
236.83 |
31.24 |
41.61 |
2265.89 |
2722.55 |
83.23 |
||||||||||||||||||
|
P3 - Mixed Pasture |
0.00 |
0.00 |
0.00 |
||||||||||||||||||||||
|
T10 - Onions-Garlic |
167.44 |
167.44 |
100.00 |
||||||||||||||||||||||
|
T13 - Sweet Potatoes |
0.00 |
0.00 |
0.00 |
||||||||||||||||||||||
|
T15 - Tomatoes |
368.59 |
5.24 |
373.83 |
98.60 |
|||||||||||||||||||||
|
T2-S - Asparagus Seed |
0.00 |
0.00 |
0.00 |
||||||||||||||||||||||
|
T4 - Cole Crops |
1.98 |
49.42 |
51.40 |
96.15 |
|||||||||||||||||||||
|
T9 - Melons,Sqsh,Cuc |
0.00 |
0.00 |
0.00 |
||||||||||||||||||||||
|
T9/F10 - melons/dry beans |
0.00 |
0.00 |
0.00 |
||||||||||||||||||||||
|
T9/t4 - Melons/Cole |
0.00 |
0.00 |
0.00 |
||||||||||||||||||||||
|
Grand Total |
31023.03 |
8.30 |
226.94 |
3420.97 |
102.70 |
5774.83 |
62.87 |
183.85 |
1791.83 |
7396.46 |
164.58 |
249.68 |
2152.41 |
2445.79 |
274.29 |
239.30 |
101.22 |
413.56 |
14.14 |
201.54 |
189.98 |
4.94 |
51.00 |
56494.21 |
|
|
% error of omission |
99.28 |
0.00 |
100.00 |
100.00 |
100.00 |
68.80 |
0.00 |
43.28 |
77.02 |
92.35 |
0.00 |
100.00 |
58.40 |
92.64 |
0.00 |
69.97 |
0.00 |
89.13 |
0.00 |
24.52 |
0.00 |
0.00 |
0.00 |
90.58 |
|
|
Note: USAGE is the DWR classification from ground surveys. CROP-LABEL data is the result of the supervised classification. |
|||||||||||||||||||||||||
Figures
Figure 1: Central Valley Project
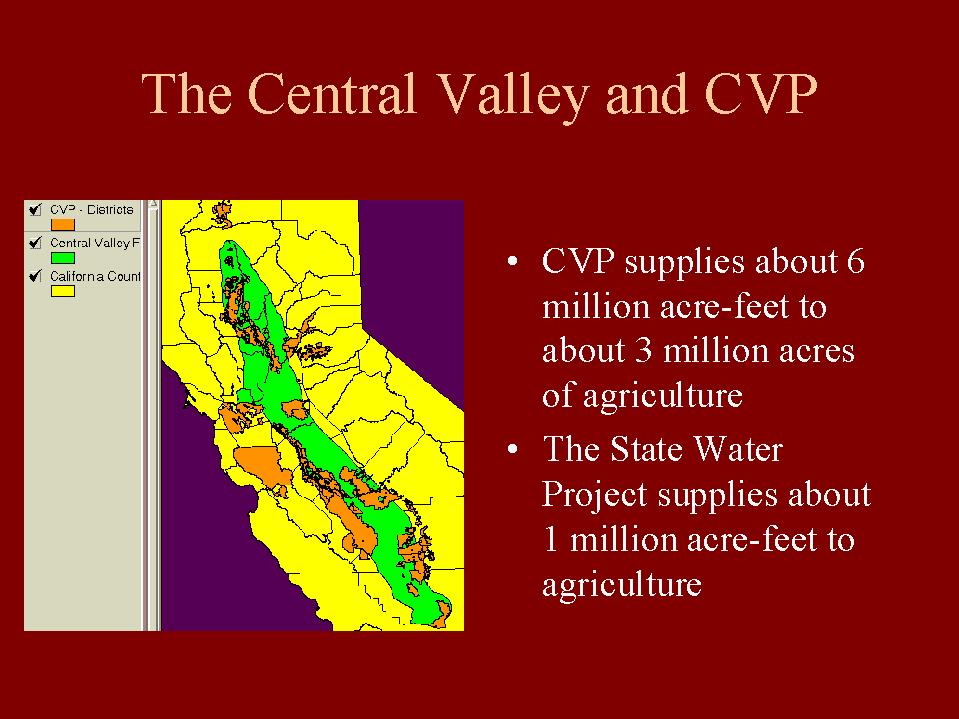
Figure 2: Yolo and Kings Counties
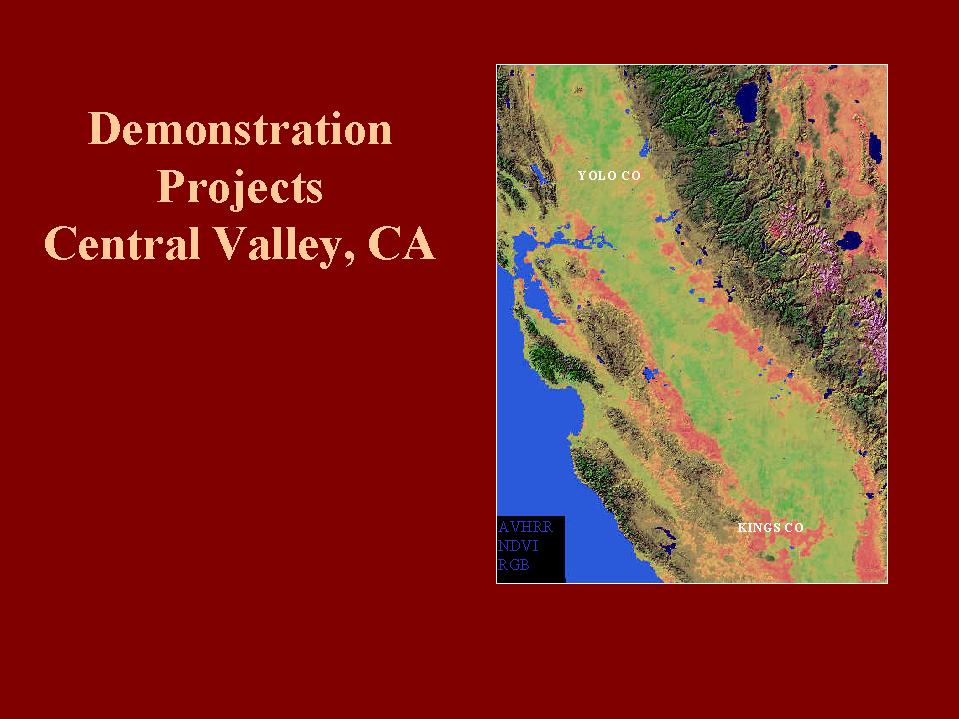
Figure 3: Kings County Acreage
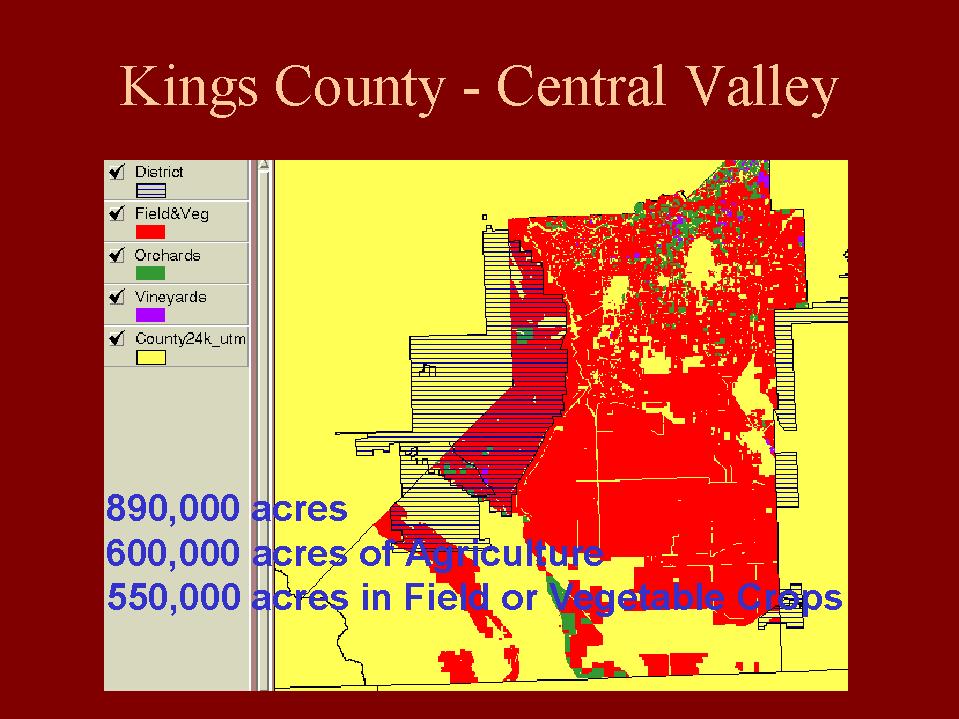
Figure 4: Field Boundaries over Landsat TM data
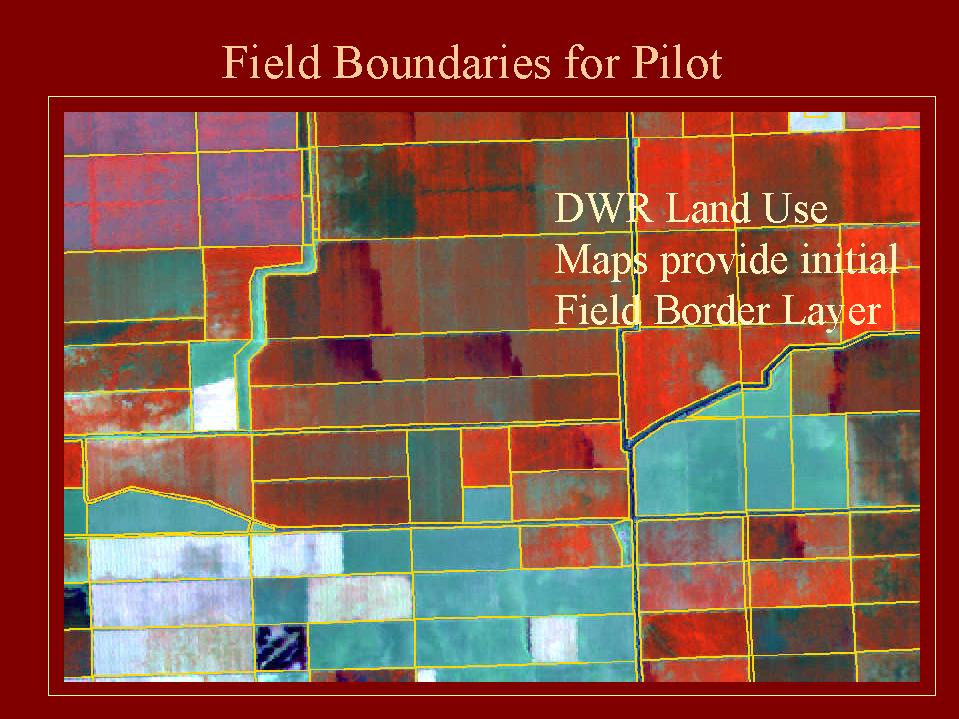
Figure 5: Spectrally Derived Signature Regions over TM Image
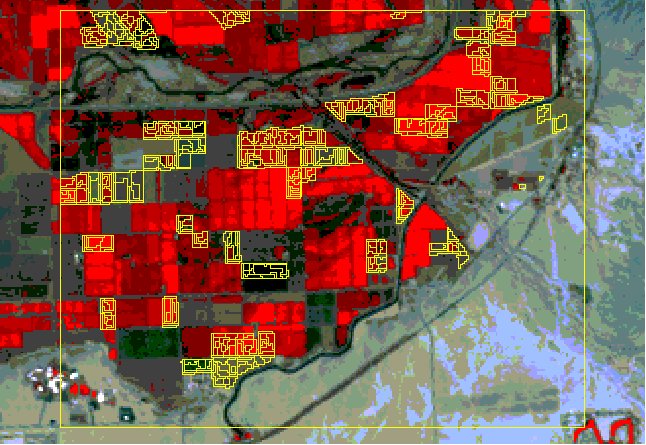
Figure 6: Spectral Regions in Single Field
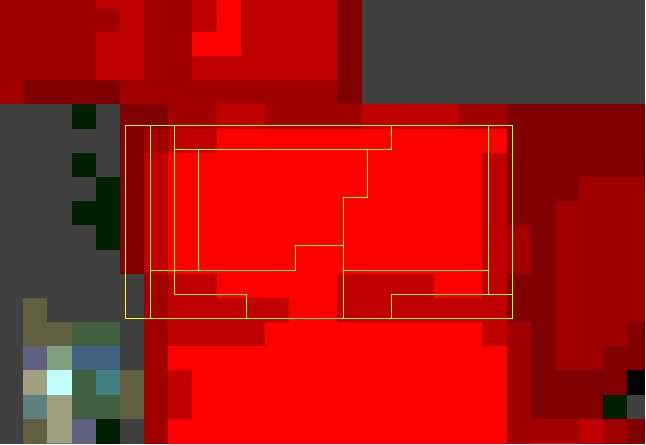
Figure 7: Signature Generation Using ERDAS IMAGINE

CADWR, 1996. Digital crop survey data. California Department of Water Resources, Sacramento, California.
Congalton, R.G., M. Balogh, C. Bell, K. Green, J.A. Milliken, and R. Ottman, 1998. Mapping and monitoring agricultural crops and other land cover in the Lower Colorado River Basin, Photogrammetric Engineering & Remote Sensing, 64(2):1107-1113.
Congalton, R.G. 1991. A review of assessing the accuracy of classifications of remotely sensed data, Remote Sensing of Environment, 37:35-46.
ERDAS, 1997. ERDAS Field Guide Fourth Edition, Atlanta, Georgia.
U.S.D.I Bureau of Reclamation, 1997. Lower Colorado River Accounting System Demonstration of Technology, Calendar Year 1995, Lower Colorado Regional Office, Boulder City, NV.
Woodcock, C., and V.J. Harward, 1992. Nested-hierarchical scene models and image segmentation, International Journal of Remote Sensing, 13(16):3167-3187.