
Virtual workbench (a)
CAVE (b)
ir. Gert van Maren and ir. Rick Germs
ABSTRACT
Virtual Reality is becoming a popular tool to visualize 3D GIS data. However, there is often very limited direct interaction with the GIS data. In this paper, we present a multi-view approach to support 3D GIS interaction within VR environments. This approach is implemented in the Karma VI system, using existing GIS and VR technology. Rather than merely a visualization tool, Karma VI is a Virtual Reality interface that supports visualization, manipulation and editing of standard GIS data. We describe the system design, system and add-on functionality and future developments.
Keywords and phrases: 3D GIS, Virtual Reality, Visualization,
and GIS Data Manipulation
Virtual reality offers new and exiting opportunities to visualize 3D GIS data. Users can walk through 3D environments, see planned buildings and appreciate changes in the landscape. In most cases, however, interaction with the data is limited to viewing. At the most there is some limited form of navigation and interrogation, e.g. the user walks around in the virtual environment and can point to objects in the scene and ask for information from a GIS database. The possibilities to interrogate the GIS database in a more intelligent way and to access more advanced GIS functionality are limited. The main reason for this is that within an immersive environment, there is no good 3D alternative for regular alphanumeric input with mouse and keyboard, for instance to formulate a SQL-query. Even if we introduce a spoken language interface, then we will still miss the spatial references and attributes to formulate these queries.
To support 3D GIS interaction within VR-environments we have developed a multi-view
approach based on three types of visualization: plan view, model view
and world view. The 'plan view' visualizes the data as a conventional
cartographic map. The 'model view' provides a 3D bird’s-eye view on a partly
symbolic and simplified 3D representation of the data. The 'world view' gives the
full immersive and photo-realistic 3D display. These views or modes can be used
simultaneously or intermittently, and each provides a repertoire of interaction
possibilities that is apt -but not necessarily limited- to that kind of visualization and
interaction.
The multi-view approach is based on the design process of large infrastructure works in
The Netherlands. Research into this design process (Verzijl, 1998), (Verbree, 1998) showed
that three main design stages can be discerned each with a different use of GIS systems:
During the orientation stage, the use of GIS systems is confined to standard 2D
functionality for creation, manipulation and analysis of geographic objects. Objects are
only indicated by position and contour. Visualization is achieved through 2D plans and
maps. In the modeling stage, infrastructure engineers are more concerned with the general
arrangement of objects, as well as size, dimension and the relationships between objects.
The use of GIS systems in this stage shifts from 2D to 3D modeling and analysis. A
3D-scale model of the construction site and its surroundings is used for both
visualization and manipulation of 3D objects. Finally, during the presentation stage, the
design will be converted into a form suitable for presentation to all participants in the
decision process. This can be done either through detailed drawings, artist's impressions,
CAD renderings, photo-collages, or with very detailed and realistic scale models. Visual
analysis is the main task at this stage of the plan process and a more realistic
visualization will only improve the presentation of the plans.
Summarizing, during the planning and development process, the plan goes through different
stages, each using a specific representation of the plans, each addressing specific ways
of analyzing and visualizing the plans. We therefore decided to use a multi-view approach
with a preferred virtual reality display system for each view.
The basic concept behind Virtual Reality (VR) is the direct coupling between the
viewing position used to generate the image on the display, the head position and viewing
direction of the user. The head position of the user is constantly tracked and fed into
the display algorithm to calculate a correct stereoscopic and perspective display of the
scene. This strong coupling of the current eye position of the user and the image offered
by the display system gives the user the illusion of 'immersiveness'. Current VR systems
range from true immersive to non-immersive displays.
A head-mounted display (HMD) is an example of a fully immersive VR display, which
effectively isolates a single user from the real environment. The CAVE (Cave Automatic
Virtual Environment) (Cruz-Neira, 1993) is a (fully immersive, multiple screen) projective
display system that offers stereoscopic surround projection to several users
simultaneously (figure 1b). Other (single-screen) projection systems are less `immersive'
than the CAVE, but a 3D impression can still be maintained. These systems are more suited
for visual presentations to groups. An interesting development is the so-called Virtual
Workbench (Krüger, 1995): a table with projection through the tabletop: the 3D image can
be visualized on top of the table or inside the table (figure 1a). Users are not
`immersed', but rather look from above on the displayed objects. It offers a presentation
mode that is normally associated with a 3D-scale model. Finally, even personal computers
can offer (non-immersive) stereoscopic display, bringing VR to the desktop (Earnshaw,
1993), (Kalawsky 1994).
|
|
Virtual workbench (a) |
CAVE (b) |
Figure 1. (a) Virtual workbench (VMSD 1999) and (b) surround projection in a CAVE (EVL 1999).
We are currently developing a 3D GIS/VR system called Karma VI, based on existing GIS
and VR technology. Development of the core system is part of the 3D GIS & Virtual Reality project,
funded by the Dutch Land Water Enviroment Information Technology (LWI) foundation. The
core system is being developed at Delft University of Technology in The Netherlands and
add-ons to the system are being developed by Asset
Forestry Limited in New Zealand.
Karma VI is a Virtual Reality interface on Esri's Spatial Database Engine that supports visualization, manipulation and editing
of standard GIS data from within a VR environment. The system uses the multi-view mode
approach where each view mode has a preferred VR display system. In the following
sections, we describe the basic set-up of the system. First, we will introduce the three
views for visualization of (3D) GIS data and then, we will describe the system components,
data models and functionality of the Karma VI system.
In this section, we elaborate on the multi-view approach and describe the visualization method and preferred display system for each view. After that we look at the user interaction modes. Next, system components and the data model are described.
As described in the previous section, we decided to implement multiple views to support 3D GIS interaction in a virtual environment (figure 2):
Visualization
Plan View
In this view, geographic data is visualized in a conventional cartographic map format
(figure 2a). Spatial objects are represented by 2D points, poly-lines, polygons and
symbols. Thematic data is visualized using standard text annotation and classification
techniques. The plan view, as described here, is comparable to the basic
visualization in most of today's GIS systems.
Model View
The model view offers a so-called bird's eye view on geographic data (figure 2b)
which makes it possible to visualize 2-1/2 D and 3D data. Visualization in this view is
kept simple and the user looks down on the model from the bird's eye viewpoint, as if it
is an ordinary 3D-scale model. The resemblance between the model view and an
ordinary 3D-scale model is not just a coincidence. A 3D-scale model offers an overview on
the area of interest, giving users the ability to make changes to the model without losing
sight of the (overall) effects of these changes. Visualization in the model view
is aimed at just that type of functionality: to let users 'model' their 3D geographic
data.
Worldview
This is the first person view on the area of interest. The purpose of this view is to give
a realistic impression of the changes in the landscape, using both visual and audio
output. The user can 'walk through' the geographic data, which are visualized using
detailed 3D CAD models and textures (figure 2c).
 |
 |
 |
Plan view (a) |
Model view (b) |
World view (c) |
Figure 2. Different view modes visualizing a part of the centre of the city of Utrecht in the Netherlands. The yellow dot in the plan view represents the position of the viewpoint for the model view and world view.
Display
Looking at the different visualization modes and functionality of the views, we can
suggest a preferred display system for each view. The plan view is most efficient
on a monitor with window and mouse interaction. For the model view, a virtual
workbench will be an appropriate display system. The world view is best viewed
with a truly immersive display, such as a HMD or a surround projection display, for
example, the CAVE.
However, it would be very inconvenient to always have to change display system when
switching to another view. Therefore, all views are supported on all available systems.
For example, it is possible to open a window in the world view to display the plan
view. Similarly, it is possible to display the world view on a standard
monitor, even if this would mean loss of stereo and sense of immersion.
User interaction
The three views require different ways to navigate through, and interact with the data.
The plan view is best suited for specifying, selecting and exploring data. The
user is able to navigate through scrolling, panning and zooming or through browsing via
hypertext links. The user interface accommodates most features of today's GIS systems,
using standard interface components like menus and icons.
The model view lets a user arrange objects like buildings, roads, trees and
bridges. When using a virtual workbench, navigation and manipulation can be steered by
gestures (e.g. using a data glove), real head movements or by using more conventional
devices like a trackball.
In the world view, attention is directed to navigation and evaluation by 'looking
at' the objects and their surroundings. Because of the lack of overview, manipulation of
objects is not considered useful in this view. The user's main activity is navigating
through the 3D scene from a first-person viewpoint, gathering information such as object
attributes and distance from the viewpoint. In an immersive VR environment, a data glove
or 'magic wand' is used for input device, to support (and enhance) the user's sense of
immersion.
GIS functions (i.e. analyses and queries) are supported in all views, although each view
has specific ways of interaction to select objects and to specify the query operators. For
instance, in the world view, it would be most natural to have a spoken-language
interface, while in the plan view a more conventional interaction method such as
a keyboard may give a better user support.
The major components of the system are the central GIS and the central VR system. For
the GIS we have opted for a system that uses one central data server. This way, Karma VI
can act as a client on the central data server in a client / server architecture and
existing GIS applications can make use of the same data. Furthermore, data consistency and
integrity can be better maintained if the spatial and attribute data are stored in one
central database. In addition, many users can access the same data simultaneously. We
selected the Spatial Data Engine (SDE) from Esri as the central GIS, and the WorldToolKit
from Sense8 as the central VR system. These systems have the advantage of an open
development environment and already have much of the required functionality.
Spatial Database Engine
SDE is capable of storing and retrieving spatial and attribute data in a centrally
maintained database built on open relational database management system (RDBMS) standards.
We use Oracle (ORACLE 1998) as our RDBMS. Karma VI is built as a client application on SDE
and uses the SDE client library to connect to the server. On the server side are the SDE
server process, the relational database management system, and the actual data. SDE uses
cooperative processing, which means processing occurs on both the SDE client library and
the server, depending on which is faster (SDE 1997) (figure 3).
Figure 3 SDE architecture.
WorldToolKit
For the VR-visualization, several modules are being developed to support the different
views. These modules are developed using one VR toolkit. The modules run on all the
available equipment, either simple monitors or more specialized equipment such as a CAVE
or a Virtual Workbench. Each system is able to support all the views, using multiple
screens if necessary. We selected the WorldToolKit (WTK) from Sense8 (SENSE8 1998) as our
VR toolkit. The WTK is a portable, cross-platform development system for visual simulation
and virtual reality applications. The interaction and visualization features of Karma VI
are built using the WTK library functions. For each of our target platforms (desktop
workstation/PC, virtual workbench and CAVE), different user interaction modes and
interfaces are required.
CAD
CAD model data are imported from external CAD-systems. At this stage, manipulation of the
3D CAD models will not be part of the Karma VI system. In the future, we might decide to
add extra functionality to be able to manipulate the 3D CAD data from within the system.
Figure 4 shows the components and the different views
Figure 4. System components and views.
As described in paragraph 2.1, Karma VI uses three types of visualization: plan
view, model view and world view. In the plan view, which
visualizes the data as a conventional cartographic map, only 2D symbolic representations
are required. In the model view, which provides a 3D bird's-eye view on the data,
simplified 3D representations are necessary. The world view, which gives a full
immersive and photo-realistic 3D display, requires 3D CAD models of GIS objects.
Each view uses its own geometric model representation of the data stored in the GIS
database. Since all views use the same GIS data, consistency between the views is
maintained. Karma VI is designed in such a way that it can handle all (2D as well as 2½D)
shape types that can be stored in SDE. The shape coordinates, which are retrieved from
SDE, are used to define the WTK geometries for the plan, model and (part of the) world
view. Shape attribute data are used to correctly generate and/or display 2½D and 3D
geometries.
For the plan view, 2D polygons are created from the 2D shape data. This is a
straightforward task for area features. However, since geometries in WTK are built up out
of polygons, point and line features have to be converted. Therefore points are
represented by small triangles and lines are buffered. In the model view, these
2D polygons are extruded by one of their attribute values, creating 2½D geometries. For
example, 2D polygons that represent buildings can be extruded by a 'height' attribute
(figure 5). In the world view, the 2D polygons created for the plan view,
are used to position 3D CAD objects. A 'height' attribute is used to define the height of
CAD geometry (figure 5). The CAD objects are linked to the original GIS shapes using a
separate table in SDE. The actual CAD models as well as their orientation and scale
parameters are stored in this table.
Figure 5. Creation of 2½D geometries from 2D geometries and an attribute value (top),
and adjusting a CAD object's scale to match the generated 2½D model (bottom).
The different geometry representations needed for the views are stored in a single scene
graph. The LOD-node mechanism provided by WTK is used for this purpose. The
level-of-detail (LOD) node offers the opportunity to store several (simplified) geometries
for one object. One can switch between these geometries depending on a specified function,
such as the viewing distance. In Karma VI, we use the LOD-node to cluster the 2D, 2-1/2 D
and 3D geometry models (figure 6). The LOD node contains the shape's database key, and the
center of its 2D geographic coordinates. The database key is necessary to enable both
Karma VI and SDE to uniquely identify objects when communicating queries and results. Each
of the geometry models is centered at the geographic coordinates stored at the LOD node.
When moving one of the models, these coordinates are updated, thereby moving all models in
real time. This way, simultaneously displayed views remain consistent at all times.
Figure 6. A Level-Of-Detail (LOD) node is used to cluster the different geometric
representations of a shape.
It is often the case that only a single CAD object is available, which represents multiple
shapes in the GIS. Cutting up this object or making independent CAD models for each of the
shapes is impractical. Therefore, CAD models can be shared by a number of different
shapes. The CAD model is linked to each of these shapes in the database. The model's
center is calculated by averaging the center coordinates stored in the LOD nodes of the
shapes.
The basic structure of the Karma VI scene graph is depicted in figure 7. The root node of
the scene graph is split up into four subtrees or groups, each having their own
functionality within Karma VI. The 'GIS' group contains all loaded GIS tables, which in
turn contain the LOD nodes with the three geometric representations. Next to the GIS data,
several other items needed for visualization and user interaction are stored in the scene
graph.
First, one or more global light sources are added to adequately lighten the scene
(contained in the light sources group). Then the geometry nodes are included. In the near
future, we will add a '3D user interface' group. This group will contain the 3D widgets to
support Virtual Reality user interfaces on Virtual Workbench and CAVE systems, and to some
extent also on desktop systems. To enhance the world view, some additional
non-GIS related objects will have to be added to the scene graph, like clouds, people,
traffic and vegetation. Some of these objects will have to be animated (e.g. clouds and
traffic). Finally, some objects will have to produce sound (e.g. cars) to be convincingly
realistic. These world view-specific objects are stored in the 'Realism' group.
Figure 7. Basic structure of the scene graph used in Karma VI.
In the following section, we describe the functionality to date of the Karma VI system. Karma itself is a core engine for visualization and manipulation of GIS data in SDE with some basic GIS functionality. On top of the core engine we are building specialized add-ons to Karma VI for specific applications. In New Zealand, for example, we are developing a virtual harvest planning system for the forestry industry. First we describe the functionality of the core Karma VI system and then we look at the functionality in the add-ons.
The core Karma VI system is a client/server application, which enables the user to
visualize and manipulate GIS data stored in SDE using the multi view approach described
earlier. Each view has some basic GIS functionality that allows the users to perform
simple analyses.
Visualization
The user can load GIS data into the different views (figure 2)
using a SQL querybox. The querybox lets the user select a layer in SDE and numeric
attribute column to extrude the 2D GIS data. The selection can be refined by using a SQL
'where' clause (figure 8). It is possible to switch to another user in runtime so data of
different SDE users can be displayed and manipulated in one session. A Look Up Table (LUT)
is used to classify the different layers.
Figure 8. The SQL querybox in Karma VI
In the world view, the user can add textures to GIS objects to increase the
sense of 'realism'. The textures can be scaled, rotated or mirrored and these parameters
are saved in the SDE database with the GIS object. Texturing objects is an easy and
efficient way to enhance the world view (figure 9). Another way of increasing
'realism' is adding true 3D CAD models. In Karma VI it is possible to 'place' 3D CAD
models on one or several GIS objects. The user can rotate or scale the 3D CAD model and
save these parameters with the GIS data in SDE (figure 10). Furthermore, a GIS object can
be derived from a 3D CAD model, by generating a so-called 'footprint', which is the 2D
outline of the model, projected onto the earth's surface. The footprint yields the 2D and
simplified 3D representations of the 3D CAD model.
The user has also options to 'enhance' the world view by adding a sky, with or
without clouds, a ground surface and additional light sources. At this stage, these light
sources are static, however in the near future it will be possible to create dynamic light
sources to, for example, simulate the movement of the sun.
Figure 9. Textures added to the roof and sides of the extruded GIS objects.
 |
 |
|
Figure 10. 3D CAD object added to two GIS objects.
Next to point, line and polygon layers, it is possible to load triangular irregular networks (TIN) in the system. A TIN is a 2-1/2D geometry representation, consisting of a (usually large) number of connected triangles. A TIN is often used to model (parts of) the earth's surface. In Karma VI, TIN's can be visualized and used to perform visual analysis of an area of interest (figure 11a). Other datasets of the same geographic area can be 'placed' on the TIN. For example, a 2D GIS dataset containing tree locations can be positioned on top of a TIN representation of the same area (figure 11b) and 3D CAD models can be added (figure 11c).
 |
 |
 |
visualization of a TIN (a) |
placing of 2D GIS data on the TIN (b) |
adding 3D CAD models (c) |
Figure 11. Visualization of a Triangular Irregular Network
Finally when running the Karma VI system in stereo mode (desktop VR, HMD, Virtual Workbench or CAVE), accessing the available functionality becomes a problem because in a 3D virtual world, the normal interface used in desktop applications (2D menus, buttons and icons) does not exist. The user perspective exist in the virtual world so 2D menus etc. outside the world are not accessible, therefore the user interface should be present in the world. At this stage Karma VI supports a basic 3D interface placed on the edge of the data (figure 12).
Figure 12. 3D interface
Manipulation
An important feature of the system is the support for manipulation and editing of GIS data
in SDE within the VR environment. Within Karma VI, several functions have been developed
to be able to manipulate, model or analyze the 2D and 2-1/2 D data directly via the
different VR interfaces. The actual manipulation, modeling and analysis takes place in the
SDE while the setting of manipulation / modeling / analysis parameters takes place in the
VR environment. For example, when the user translates and rotates an object in the model
view, only the transformation parameters are sent to SDE where the original data is
updated. Since we are using a client/server architecture, it is also possible to edit and
analyze the data with external GIS applications such as ArcView.
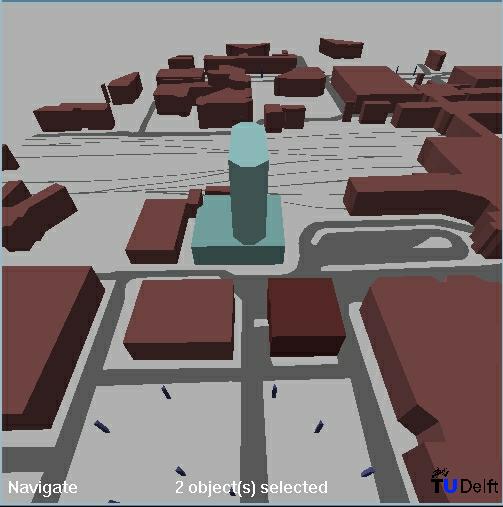
Basic translation and rotation functions are available in Karma VI. With these functions,
it is possible to manipulate individual or groups of GIS objects (see figure 13). Groups
of objects are moved and rotated as a single object. Since all objects are defined in 2D
(or 2-1/2D) space, rotation is allowed only around the vertical (Z) axis. Collision
detection checks are performed in Karma VI as well as the SDE database when the user wants
to save the changes. In case of a collision between two objects, no save is made to the
database. Original position and rotation can be restored using the 'undo' functionality.
Furthermore it is possible to delete objects in the scenegraph and the SDE database as
well.
 |
 |
Figure 13. Move and rotate individual, or groups of GIS objects. Left: two GIS objects
are selected for manipulation. Right: After translation and rotation, changes are saved in
the GIS database
Navigation
In the plan view, conventional ways of navigating through 2D data, like panning
and zooming, are used. In three dimensional space, a user can 'fly', 'walk' and 'zoom'. In
'fly'-mode, the user moves around freely through the data. 'Walk'-mode lets a user see the
data from the perspective of a person walking along the surface. In this mode, collision
detection and terrain following are used. Collision detection makes sure the user cannot
walk through walls or other solid objects by testing intersection of the users' direction
vector with objects in the dataset. Terrain following is a special form of collision
detection, which adapts the viewpoint to be at a fixed distance (in this case, 1.80m) from
the underlying terrain surface. Zooming is possible to individual object or to groups of
objects. Finally, a special 'Fly to' mode is available, which smoothly moves the user's
viewpoint to a selected 3D point, e.g. clicked on by the user in the current view.
GIS
Basic GIS functionality is available in all views. At this stage of the project, the
following GIS functionality is implemented:
Select by SQL query
This functionality lets the user select objects in the different views by way of a SQL
query. The SQL query is sent to SDE where the objects that fit the query are determined
and the result is visualized in all views.
Identify
GIS objects can be identified from plan, model and world view by selecting an
object. The record containing the object's thematic data is then retrieved from the SDE
and displayed.
Buffer operations
Performing a 2D spatial query or buffer is a typical GIS operation for which Karma VI
provides a front-end. A user selects a single GIS object and sets buffer parameters (see
figure 14, left and middle). These parameters are the buffer radius, and the GIS layer (or
thematical dataset) in which the spatial query is to be performed. This information is
sent to the GIS database, which then creates a temporary buffer object and calculates
which objects are (completely inside) this buffer object. Within Karma VI, the objects are
then highlighted and selected (figure 14 right).
 |
 |
 |
Figure 14. Selection of GIS objects within a user-defined range using a 2D spatial buffer algorithm.
Measuring distances
Measuring distances is a simple GIS analysis, which can easily be integrated in a Virtual
Reality environment, when accuracy is not an issue. With Karma VI, users can interactively
'measure' distances between 2D or 3D GIS objects by pointing and dragging a 3D line (see
figure 15). This allows a quick analysis of object-to-object distances, CAD model detail
dimensions and object heights.
 |
|
Figure 15. Interactive distance measurement in 3D space.
As described in the previous paragraph, Karma VI is a core engine for visualization and manipulation of GIS data in SDE. We implemented the core system in such a way that specialized add-on's to Karma VI can be easily built to address specific problems. In New Zealand, for example, we are developing a virtual harvest planning system on top of Karma for the forestry industry.
Virtual harvest planning system
The process of harvest planning is the controlled design of a series of future events
surrounding the flow of a timber resource from the stump, to the log product destination.
There are three stages in the harvest planning process. The first type of planning is the
long term or strategic planning, incorporating a total forest estate inventory, growth and
yield potential and market information to schedule the harvest of parts of the forest
estate. The second type of planning is tactical planning in which logging system choices
are made, annual cutting plans and detailed logging plans are prepared. This involves
preparation of working plans, detailing locations of roads and landings, defining methods
of extraction, loading and transport to be used. The third type is preparation of day to
day management systems for control of operations.
A virtual harvest planning system can be extremely helpful during the second stage of
the planning process. During this stage, planners need to get a 'feel' for the way the
country is put together. Traditionally, this is done with the help of 2D contour maps and
a considerable amount of field checking. The field checking can prove to be quite
difficult and time consuming. Ground visibility can be poor due to steep terrain, thick
undergrowth and mature forest vegetation since tactical planning is often done when the
forest is mature. The amount of time in the field can be greatly reduced by a system such
as Karma VI. Planners can get a 'feel' for the country by flying over it in virtual
reality and switching the vegetation on and off (see also figure 11).
Also analyses such as the planning of roads, the locating of harvesting landings and
analysis of different harvesting options can be done faster using Karma VI.
Road planning
Development of the virtual harvesting system started earlier this year and at this stage
the add-on supports interactive road planning. The user can draw a line on the terrain by
clicking points in the 3D views (figure 16a). The system then calculates a line through
those points following the terrain. The line is visualized by polygons that are classified
by degree of slope (figure 16b). These polygons can be saved in the SDE database so the
planner can print out his road on a 2D map (for example in ArcView, figure 16c). Future
functionality will involve real time interactive manipulation of the road line.
 |
 |
 |
||
Drawing of a road line (a) |
Visualization and classification (b) |
Same road line viewed in ArcView (c) |
Figure 16. Interactive road planning.
At present, Karma VI is operational on PC, Virtual Workbench and the CAVE. Basic geometry manipulation of the GIS data within a virtual environment such as translation and rotation is available. For support of more general geometric manipulations and conversions, we will develop a constraint-based model to support 'intelligent' geometric manipulation. Basic GIS functionality like 'identify', 'spatial buffering' and 'query based selection' is available. In the near future, we will further explore 3D GIS functionality like 3D network analysis, 3D buffering and volume calculations. To display the result of the analyses we need a general repertoire of coloring and texturing tools.
For more elaborate analyses and simulations it would be convenient to have a general application interface to the system, that will allow a remote application to retrieve GIS data from the database, perform a simulation with the data, and then return the results in the form of 3D objects, movements of objects, or as symbolic visualizations. For instance, a program for sound simulation would be able to retrieve the geometry of the terrain and a sound-protecting shield, and would then return a value for each position in the terrain, which could be visualized with pseudo-coloring in the model view, or be heard as audio in the world view.
Since geographic data sets tend to be quite large, problems arise when visualizing GIS data. As well as GIS data, enormous amounts of CAD data may have to be visualized. Therefore, some optimization is needed to ensure enough graphic performance for real-time display. As already mentioned, the WTK supports the use of Level-Of-Detail techniques: several versions of the same object with varying levels of detail can be stored, but only one of them is displayed at any given time. Whenever a viewer gets closer to the object (and is able to see more detail), a geometry with a higher level of detail is selected. A lower 'level of detail' geometry consists of less polygons, and would therefore need less calculation time than a more detailed geometry. A similar technique is Dynamic Object Loading. When detailed GIS or CAD objects are not visible (e.g. behind or very far away from the viewer), they are only taking up memory and valuable processor time. To minimize memory usage, these objects should be loaded into memory only when the viewer is close enough to see them. Another technique is 'horizon mapping' which technique uses 'horizon maps', that capture the horizon part of one frame, and re-uses this part in consecutive frames.
Next to optimizing graphic performance, we will further develop the user interface. The interface should be easy-to-use and intuitive, and yet efficient. While this is already a big problem on desktop systems, on true VR systems like the Virtual Workbench or the CAVE, it is even more difficult. For example, in a CAVE, the use of a keyboard for text input is not possible. We may have to introduce speech recognition to enable spoken commands, and develop a way to let users specify queries in a combined graphics and spoken-language dialogue. Furthermore, displaying alphanumeric results of a query in a 3D environment will be a problem, especially when a lot of information is returned. This information must be presented to the user in such a way, that the user does not loose his/her sense of immersion. This means that the information must only fill a small part of the user's field of view, or that the information is integrated into the 3D world (e.g. projected onto the walls of a virtual building). Apart from textual or spoken language input and output, visual tools (3D widgets) will have to be developed to let users access the GIS and modeling functionality (e.g. 3D analyses, manipulation) of the system.
This paper provides an overview of the 3DGIS/Virtual Reality system called Karma VI. Karma VI is a virtual reality interface on Esri's Spatial Database Engine that supports visualization, manipulation and editing of standard GIS data in a VR environment. The system uses a multi-view mode approach where each view mode has a preferred VR display. Development of the core system is part of the 3D GIS & Virtual Reality project, funded by the Dutch Land Water Enviroment Information Technology (LWI) foundation. The core system is being developed at Delft University of Technology in The Netherlands and add-ons to the system are being developed by Asset Forestry Limited in New Zealand.
Cruz-Neira C., D. J. Sandin and T. A. DeFanti (1993) Surround-screen Projection-based
Virtual Reality: The Design and Implementation of the CAVE, in Computer Graphics -
Proceedings of SIGGRAPH 93.
Earnshaw R.A., M.A. Gigante and J. Hones (1993) Virtual Reality Systems, London: Academic
Press Limited.
Esri (1998) Homepage of Environmental Systems Research Institute, Inc. Accessed June 1999.
http://www.Esri.com/base/products/sde/sde.html
EVL (1998) Homepage of Electronic Visualization Laboratory. Accessed May 1999. http://www.evl.uic.edu/EVL/VR/systems.html#CAVE
Kalawsky R.S. (1994) The Science of Virtual Reality and Virtual Environments,
Cambridge: University Press.
Krüger W., C. A. Bohn, B. Fröhlich, H. Schüth, W. Strauss and G. Wesche (1995) The
Responsive Workbench: A Virtual Work Environment. IEEE Computer Society, IEEE Computer,
Vol. 28, No. 7, pp. 42-48.
ORACLE (1998) Homepage of the Oracle Corporation. Accessed June 1999. http://www.oracle.com
SDE (1997) Technical documentation. Accessed July 1999. http://www.Esri.com/base/products/sde/sde_api.html
SENSE8 (1998) Homepage of the Sense8 Corporation. Accessed June 1999. http://www.sense8.com
Verbree E. and L.D. Verzijl (1998) Integrated 3D-GIS and VR: Use of Virtual Reality and
3D-GIS within the Planning Process concerning the Infrastructure, in Proceedings of the
10th Annual Colloquium of the Spatial Information Research Centre, University of Otago,
Dundedin.
Verzijl L.D. (1998) Toepassingsmogelijkheden van 3D-GIS en VR, Delft, University of
Technology.
VMSD (1998) Homepage of Visualization and Media Systems Design:. Accessed May 1999. http://viswiz.gmd.de/VMSD/PAGES.en/projects.workbench.html
WTK 1998, WorldToolKit Reference Manual, Sense8 Corporation
Gert van Maren is one of the primary developers of the Karma VI system. He works as a GIS/VR programmer for Asset Information Systems in New Zealand and as a part time researcher for the Department of GIS Technology, Delft University of Technology, The Netherlands.
Rick Germs is also one of the primary developers of the Karma VI system. He works as a fulltime researcher for the Faculty of Information Technology and Systems, Delft University of Technology, The Netherlands.
ir. Gert van Maren
Asset Information Systems: division of Asset Forestry Limited, Auckland, New
Zealand and
Department of GIS Technology, Delft University of Technology, The Netherlands
 |
Asset Information Systems Unit A, 1 Cebel Place PO Box 102 032 NSMC Auckland, New Zealand |
Ph: +64 9 4152052 Fax: +64 9 415 4982 Mobile: +64 25 358521 Email: gert@infosystems.co.nz |
|||
 |
Contact: |
ir. E Verbree Thijsseweg 11 2600 GA Delft The Netherlands |
Ph: +31 15 278 2584 Fax: +31 15 278 2745 Email: e.verbree@geo.tudelft.nl |
ir. Rick Germs
Faculty of Information Technology & Systems, Delft University of Technology, The Netherlands
 |
Computer Graphics & CAD/CAM Group Zuidplantsoen 4 2628 BZ Delft The Netherlands |
Ph: +31 (0)15-2782795 Fax: +31 (0)15-2782745 Email: h.m.l.germs@its.tudelft.nl |