The role of GIS at meteorological institutes
has long been limited, partly because of the specific data formats used
and partly because of already embraced "GIS-like" applications. An interesting
role seems to be reserved for GIS in the area of data management, thus
improving the accessibility of huge amounts of valuable meteorological
data sets for a wide range of users. The knowledge and experience that
has been gained in the GIS community can help a meteorological institute
to, for example, manage data by adopting metadata standards and distribute
data by applying Internet GIS technology. At our institute, GIS is discerned
as a catalyst tool that helps to develop the data infrastructure.
The Royal Netherlands Meteorological Institute (KNMI) is the expert center for meteorology, climatology and seismology in the Netherlands. As such, huge amounts of data are processed, ranging from simple rain gauge measurements to advanced wind observations from space-borne scatterometers. However, only a selection of all the weather data and derived products is being subjected to some storage strategy; instead especially satellite imagery is lost after being used for forecasting purposes. For example, there is currently no long-term storage of Meteosat satellite images at KNMI, apart from personal archives. Obviously, Eumetsat (Europe's Meteorological Satellite Organization located in Darmstadt, Germany) has its own Meteosat archive (Meteorological Archive and Retrieval Facility or MARF) ensuring the availability of satellite imagery for member states.
A different situation occurs at the climatological department of KNMI where a comprehensive database is maintained. These data are acquired through KNMI's network of stations and as such, they are unique for the country: if the climatological department fails to acquire, validate and store the rainfall on a particular day, gaps will occur in the historical time series! In order to make these data available to a larger group of users within the meteorological institute, a metadata system has been developed. As a consequence, storage as well as retrieval routines benefit from the systematic description of the considered data sets. In addition, the department has embraced GIS technology to further disseminate their data and products within the institute. The results have triggered interesting developments relating to improved access of other data sources at KNMI.
Take again satellite data as an example; they are getting more and more important in meteorology and therefore there is a growing need to store these data in a more structural way. Also, a more flexible information extraction is desired, i.e. virtually anyone at KNMI should be able to access the data and to derive the required data according to some predefined extent. The idea of an image database has been proposed, and because of the large data volumes the establishment of a metadata information system is inevitable.
In this paper some infrastructure issues
at KNMI will be presented, concentrating mainly on the development of the
above-mentioned metadata base and the ideas concerning the (internal) dissemination
of these data. First, a closer look will be taken at the considered satellite
data and the expected increase of data volumes in the next few years.
The role of satellite data in meteorology
and climatology has increased considerably during the past 20 years as
appears from the inventory of the Coordination Group for Meteorological
Satellites (CGMS). On
the internet, weather sites provide snapshots of the images which not seldom
reveal fascinating structures, especially when presented as an animation
of a series of sequential pictures from geostationary satellites such as
GOES and Meteosat (geostationary means that the satellite has a fixed relative
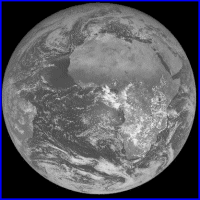
position above the Earth). For KNMI, the Meteosat series of meteorological
satellites is of the utmost importance in operational weather forecasting
as it provides a general view of relevant weather structures, thereby supporting
the meteorologist during the forecast. Besides, the images are getting
increasingly interesting as input for numerical weather and wave models.
Finally, they help to explain changes in world climate research. The Meteosat-7
satellite that is positioned at a longitude of 00 provides images
of Western Europe and Africa (see figure 1) from a height of 36.000 km
while being in a geostationary orbit.
As from 2001, a new series of Meteorological satellites will be operational, namely Meteosat Second Generation (MSG). The characteristics of the on-board instruments differ considerably from their predecessors, in such a way that spectral, radiometric, spatial and temporal resolutions have been improved. Instead of every 30 minutes, images are taken on a 15 minute basis while the number of spectral channels has been increased from 3 to 12! Spatially, the resolutions will be more or less halved: 1 km for the high-resolution visible channel and 3 km for the other channels. Clearly, this means a significant increase in data volumes, apart from possible compression techniques that will be used during data transfer. Approximately, the data flow from Meteosat will rise from 1 to 20 gigabytes per day for KNMI! Also, a new series of polar orbiting satellites (METOP) will be launched in a couple of years as part of a joint European/US initiative, the Initial Joint Polar System (IJPS). Together with NOAA satellites, METOP will contribute to a continuous coverage of the earth. Again, more data are to be expected in the next years...
Given the relevance of satellite meteorology and the extent of the emerging data flow, strategies have to be developed in order to anticipate a smooth information extraction. Decisions concern issues such as :
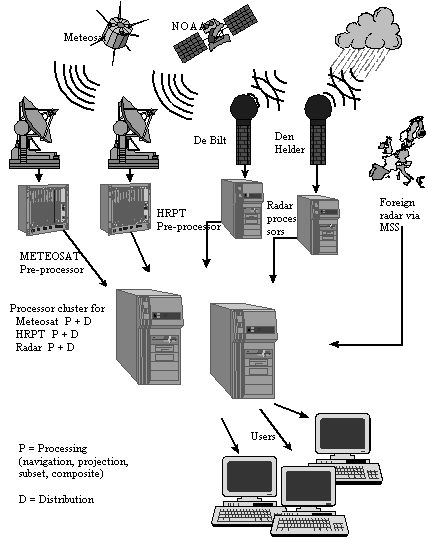
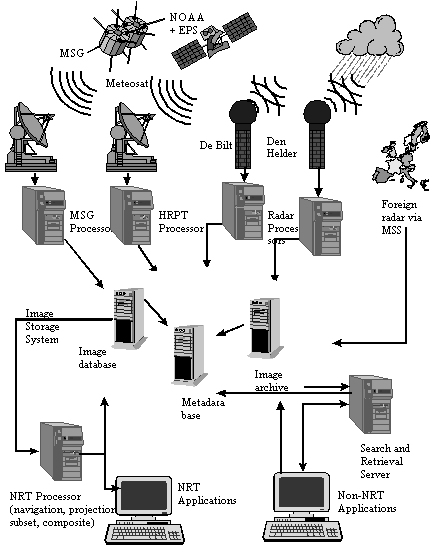
selected group of users (figure 2). Interactive querying islimited and storage non-structural. An arbitrary user within the institute who wants a specific subset of a Meteosat image of July 1, 1999 is therefore dependent on the resources and skills of an individual scientist. A far more preferable situation would be the one that is depicted by figure 3, in which a high level of interactivity is envisaged. Moreover, storage capacity is added and processing of data is made possible in a near-real time, operational as well as off-line mode. The latter refers to some sort of application shell from which users can access and process the data in order to arrive at customized image products. As an example of the latter, (re-)projected images and image composites (visible and infrared) could be mentioned.
Figure 3 reveals an image database
as well as an image archive, indicating different storage and access strategies.
The idea is to store all received image data in the database for about
2 weeks, whereafter they are moved to a short-term archive (about 3 months
- 1 year). After 1 year, a data set is "expired" and a decision has to
be made concerning the desirability of further storage. Dependent on the
uniqueness of the data, they can be moved to an "eternal" archive.
Most likely, the images will be stored in the Hierarchical Data Format (HDF) issued by the National Center for Supercomputing Applications (NCSA). HDF comprises a data format for large, scientific data sets, that is available in the public domain. All libraries for I/O together with tools for analysis and visualization are freely available through the internet. HDF is not supported in Esri software yet, but there has been done some work on conversions between GIS formats and HDF (or HDF-"profiles"), for example in the framework of NASA's EOSGIS project. This project aims at the exchange of data from the Earth Observing System (EOS) satellites with the GIS community. Not only NASA but also NOAA is among the organizations that have adopted HDF as a major archiving format for satellite data. The characteristics that make HDF attractive as a storage format have been evaluated by the NCSA itself. From this it appears that next to the main advantages (self-describing, compact, not specific for one platform or operating system, open format, widely used) there are some points for attention, in particular the development of access software. However, it is not the scope of this paper to go into too much details concerning HDF.
The above outline, although brief,
offers grips for a more extended discussion about the role of GIS in the
dissemination of weather data.
In the introduction, the climatological department has been mentioned as a forerunner in the development of a metadata base and the recognition of GIS as a major analysis and visualization tool. Given the satellite data infrastructure being dealt with in the previous section, it is interesting to find out if lessons can be learnt from the experiences at the climatological department.
The data base that is used for storing climatological information of the Netherlands is a relational data base (Oracle), that can be accessed through a prototype relational metadata information system (MDIS). This MDIS system can be consulted through the intranet and the underlying model is based on the metadata standard that is proposed by the Comité Européen de Normalisation (CEN), Technical Committee 287 (Geographic Information Systems). This search and retrieval mechanism is still very limited as it concerns only observations from the network of weather stations. Nevertheless, it provides a means to demonstrate the way in which persons within the institute (and in the future also outside) can retrieve information about the available datasets and about the possibility to actually extract that data from the database.
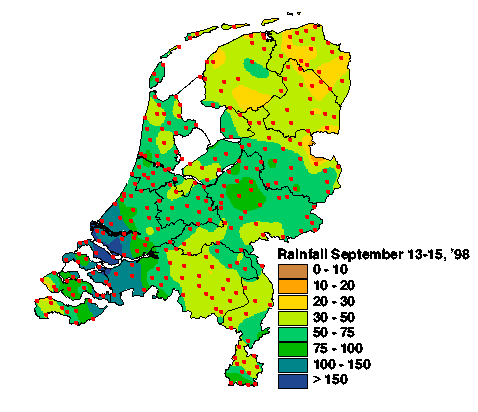
The next step is the processing of the data in the user environment; for example, a set of station observations revealing daily precipitation values can be further processed to spatial distributions after applying some interpolation approach (figure 4). Clearly, a GIS offers the required functionality - at KNMI Arcview extended with the Spatial Analyst is used to meet the demands of the user.
However, not everyone within the institute
has the disposal of the GIS tools to derive such products. Therefore, yet
another approach is adopted, namely the preparation of datasets within
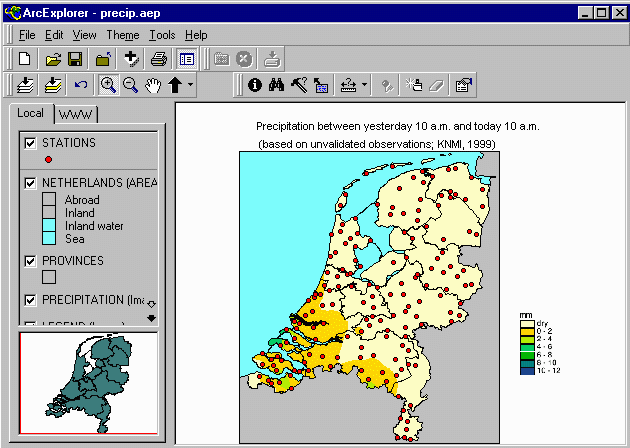
an ArcExplorer project file (figure 5). Each day, the climatological department
derives a rainfall map covering the past 24 hours. This Arcview-generated
map is stored in an ArcExplorer project that is accessible via the internal
network. Every PC user that has ArcExplorer installed can open the project
and work with the data. The advantage of this approach is that together
with the spatial extent of the considered information (here: rainfall)
also some explorative tools are offered to the user (panning, zooming,
query).
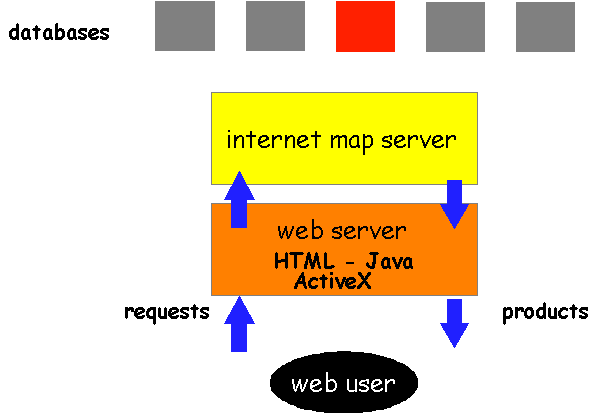
Proceeding to an even better data dissemination
brings us at Internet Map Server (IMS) technology. At KNMI, some experience
has been gained with Map Objects IMS 2.0. The different possibilities on
the client side of the "three tier structure" as defined by Esri (figure
6) allows for a flexible and convincing way of information transfer. The
ActiveX version of ArcExplorer (AEX), integrating GIS functionality within
the web browser, appeared to be very persuasive, apart from the drawbacks
that can be formulated for ActiveX in general (Microsoft-bound, lack of
security, large controls...). The idea to use the intra-/internet browser
for consulting the climatological database and simple but sufficiently
equipped map services for the subsequent retrieval and processing of these
data is currently the subject of serious discussion within the institute.
The willingness to apply IMS technology appears from KNMI's intention to
act as a node in an international climatological network that connects
climatological databases, fully web-enabled through dedicated map services.
Returning to the original goal of this
paper, the question arises: can standard GIS tools be useful within the
pursued application shell of the image database? Or more general: can GIS
help to systematically store and retrieve image data sets? In order to
answer these questions, the discussion will be divided in three parts:
metadata, (pre-)processing and visualization.
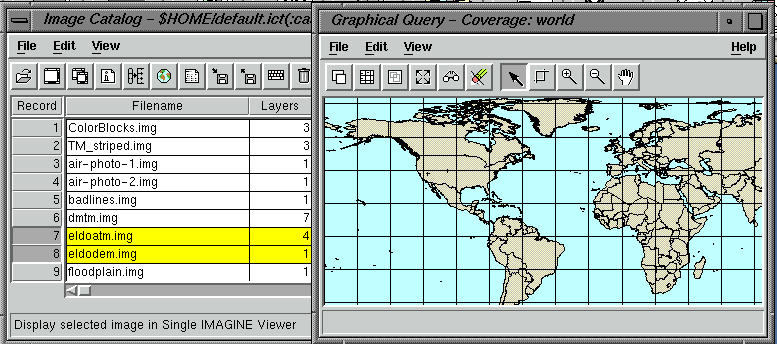
The integration of meta information
systems and GIS is increasing. An example is Arc/Info's 8 ArcCatalog and
Erdas' Catalog (figure 7), the latter especially designed for images. These
tools allow for the management of data that are used within the GIS environment.
As KNMI's image database is not exclusively dedicated to GIS users, this
integration could be vulnerable. Of course, such tools could be part of
the metadata solution.
Another point that is related to metadata
is the self-descriptive character of HDF, the archive format currently
being reviewed. Metadata is allocated to specific "tags" within the file
structure while allowing for other, institutional or application-specific
metadata by providing "free" tags. Before using HDF data in a GIS application,
this metadata should be extracted.
One of the most obvious processing
tasks of a GIS application around an image database is probably the derivation
of areas-of-interest. Often users only require a subset of the image(s)
after having defined the extent in some geographic terms (coordinates or
bounding polygon on a map). Another task would be the (re-)projection of
the data in order to enable the user to combine the images with other spatial
data. At KNMI, this means often a transformation to a Polar Stereographic
projection. Virtually any user within the organization should have the
disposal of such tools, be it as stand-alone or networked applications.
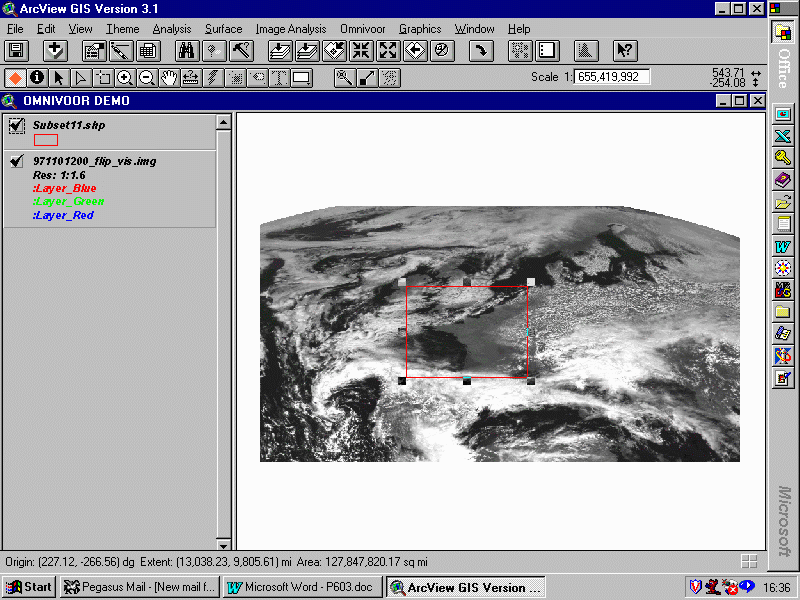
Dedicated tools for image processing, such as Erdas Imagine, are too complicated
and extensive for the majority of the (inexperienced) users. The new Image
Analysis extension for Arcview could prove to be valuable as it is embedded
in the already accepted Arcview GIS infrastructure at KNMI. During several
weeks, experience was gained with a test license of this extension, e.g.
by writing scripts for data conversion and interactive subsetting of Meteosat
images (figure 8). The results were satisfying, especially because of the
high degree of customization that is allowed in Arcview and the availability
of a wide range of image processing and GIS tools. It is, however, too
early to indicate whether or not such an extension is valuable for the
pursued application shell.
The ease with which data can be visually
explored within a GIS is surely contributing to the wide acceptance of
these tools. A simple spatial distribution of the data provides a user
already with valuable information, for example the correctness of the position
of weather stations, the density of observations and the structure of cloud
systems. Climatological data retrieved from the relational database can
be directly visualized in Arcview; the images that are stored in HDF need
some conversion in order to process and visualize them in Arcview. The
development of the Image Analysis extension proves the relevance of remotely
sensed data for the GIS user. Hopefully, both Esri and Erdas will consider
the support of formats such as HDF in future releases, thereby linking
up with vendors such as ER-Mapper, EASI/pACE, ENVI and PV-Wave.
KNMI is developing a new infrastructure
for its increasing satellite data flow. The focus is on archiving strategies
and the development of applications that can be used "off-line" by virtually
any user within the organization. Metadata plays a key-role in this development
and much can be learnt from the experiences that have been gained with
the metadata information system of the climatological department. An application
shell around the database must provide the tools with which users can extract
the required data and generate the desired products. As imagery will be
stored in a different format than the climatological data and, moreover,
requires a different processing approach, it is critical whether or not
they can benefit from standard GIS applications. It is, however, preferable
to use Commercial Off-The-Shelf GIS because it contributes to a standardized
application shell, helping the dissemination of weather data within KNMI
and between KNMI and third parties. In order to achieve this, data as well
as metadata stored in HDF should be accessible from the Arcview environment.
The author wishes to thank Dr Sylvia
Barlag of KNMI for her kind permission to publish figures 2 and 3 and Drs
Albert Klein Tank for preparing figure 5.