Mass conversion of MGE/Framme Data - Distributing High-Precision Data to Gas Engineers
By
Rasmus Holm Jensen1, Søren B. Andersen1 and Vagn Gade Hyldgård2.
1: Informi GIS A/S, Maglebjergvej 6, 2800 Lyngby, Tel: +45 45 28 00 00
2: Naturgas Midt-Nord, Vognmagervej 14, 8800 Viborg, Tel: +45 87 27 87 27
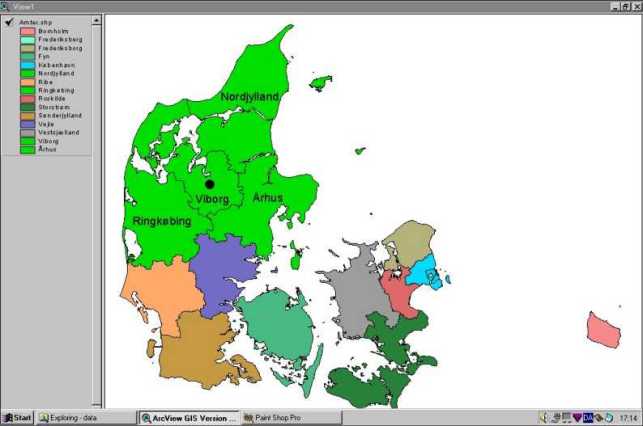
Naturgas Midt-Nord is one of 5 regional Natural Gas Companies in Denmark. Naturgas Midt-Nord covers the northern part of Jutland, this is almost half the area of Denmark (Figure 1). Besides maintaining the gas pipe network, selling and distributing the natural gas the company also maintains a large GIS database for the entire area.
Figure 1. Map showing the four counties (green) in Jutland covered by the Naturgas Midt-Nord database. The area is almost half the area of Denmark. The location of Naturgas Midt-Nord is shown.
This database serves different purposes: First of all it is used as a basis for Naturgas Midt-Nords own planning, maintenance and surveillance of the pipe network. Digital maps are used extensively in order to provide up to date information to the engineers in the field. Another purpose with the database is to administer and maintain digital data for those municipalities in the area that do not have the resources, or do not want to maintain their own GIS-database.
In order to distribute data in the organisation an HPGL-based data viewer was previously used. The problem with the use of HPGL data was the fact that the turnaround time for converting all MGE and Framme data into HPGL format was 3 months. Therefore the following strategy was suggested:
Naturgas Midt-Nord was formed in 1982, and is owned by 73 municipalities (out of 88) in the area. At the moment Naturgas Midt-Nord has 170 employees.
The company sells 1.2-billion m3 natural gas a year (1998). The natural gas is distributed in the company’s own pipe-network which consists of steel pipes as well as plastic pipes. The company is, areawise, the largest regional Natural gas-company in Denmark.
The data in the GIS-database provides, as mentioned earlier, the basis for planning and maintenance of the entire pipe-network. The data are also used for other purposes, such as analysis, presentation and as technical maps in the municipalities. To serve all these different purposes the data has to be highly detailed and accurate. Furthermore the data have to be updated on a regular basis in order to keep the data up-to date. All data are maintained and stored in a combined MicroStation and Framme environment, with Oracle being used as the attribute database. Generation of new data are handled by subcontractors
The data in the database can be divided in two categories:
Basemap data (MGE-data) comprises, among other features: roadsides, houses, forests, streams, powerlines and street centrelines. In built-up areas the data are more detailed than in non built-up areas.
Gas data (Framme-data) comprises all gas pipes (steel and plastic), vents, measure and reference points making up the gas pipe network. The gas data are highly detailed and are in some areas even more detailed than the corresponding basemap data.
The area covered by the database is approximately 20,000 Km2 (Figure 1). Data are organised and stored in a very stringent way and on different levels depending on the datatype.
Data are produced with the highest possible degree of accuracy. There are four levels of accuracy, these are:
|
0-25 cm (0-9.84 in.) |
|
25-50 cm (9.84-19.68 in.) |
|
50-100 cm (19.68-39.37 in.) |
|
100 cm (>39.37 in.) |
It is always possible to get information about the accuracy of the individual features because the information is stored as an attribute in the Oracle database.
The completeness of the data is another important factor; the levels of completeness are 97% for buildings and 95% for all other features.
The basemap data are stored in MGE-files each covering a rectangle with the dimensions 2*3 km called a MV-Plan (Figure 2). Each MGE-file contains up to 80 different feature types. The size of these MGE-files varies from approximately 100 kb to > 5 Mb, and the number of features in each file varies from 3-400 features to more than 15.000 features respectively. In total there are 3800 MGE-files taking up 1,5 Gb of diskspace. Because the basemap data contains a large number of different features (Table 1) it is possible to make cartographically pleasing maps, but also to use the data as the basis for analysis and planning.
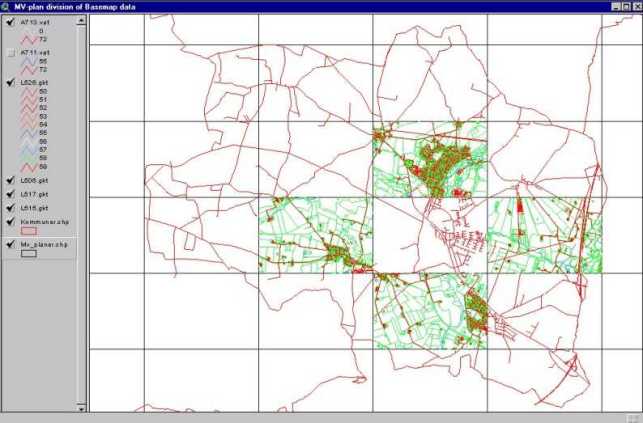
Figure 2. The basemap data (as well as the gasdata) are stored in a filestrcuture called MV-plans. Each MV-plan covers 2*3 km. The storagelevel above MV-plans are the municipalities. Street centrelines and forests are stored at the municipality level.
Table 1.
|
Featuretype |
Featurecode |
|
Building, roof |
501 |
|
Building, wall |
502 |
|
Windmill |
561 |
|
Roadside |
511 |
|
Ditch |
528 |
|
Powerline |
545 |
|
Powerline pole |
546 |
|
Drain grating |
550 |
|
Well cover |
551 |
|
Stream 2.5-7.0 meters wide |
577 |
|
Stream 7.0-12.0 meters wide |
580 |
|
Deciduous tree |
534 |
|
Coniferous tree |
535 |
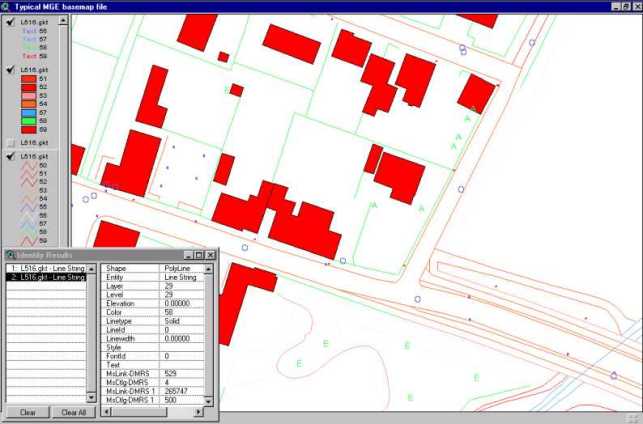
Figure 3. Typical contents of a basemap file from a built-up area. Several types of features are visible in this area. House polygons are the most significant features. Roadsides, trees, well covers and streams are also visible. The identify-window shows the attributes for a house feature. The MsLink-DMRS attribute is the featurecode and the MsLink-DMRS_1 attribute is the link to the attribute database.
A typical municipality comprises 35 MV-plans and has the following composition:
6 km2 built-up areas
205 km2 non built-up areas
10.400 inhabitants
Street centrelines are not part of the basemap data. The street centrelines and the address points are stored in files corresponding to the municipalities (Figure 2). There are a total of 88 municipalities in the area. The street data are just as detailed as the basemap data, and contains the street centrelines. For each roadsegment it is possible to retreive information about the type of road, the width of the road and other administrative information. The address points are contained in the same files as the street centrelines.
Besides the basemap and street centreline data various other digital data are stored in the database. These other datasets comprises e.g. forested areas and administrative boundaries.
The attributes for all the basemap and street data are stored in an Oracle database. The link between the data and the attributes are the standard Microstation MS-Link key (Figure 3).
The basemap data, combined with the rest of the data, provides the end-users with the ability to make very detailed maps suitable for both analysis and presentation.
The gasdata are maintained with Framme and stored in a different system than the basemap and street centreline data. The structure and storage of the gasdata are the same as for the basemap data, with all data divided into MV-plans. The gasdata are in some areas even more detailed than the basemap data due to the fact that the gasdata contains not only the major gaspipes and vents, but also the small pipes going into the individual houses and the vents and junctions on these pipes as well (Figure 4).
The gas data has an associated attribute database, and the link between the attributes and the features are the combination of the RB-primary and RB-secondary values for the individual feature.
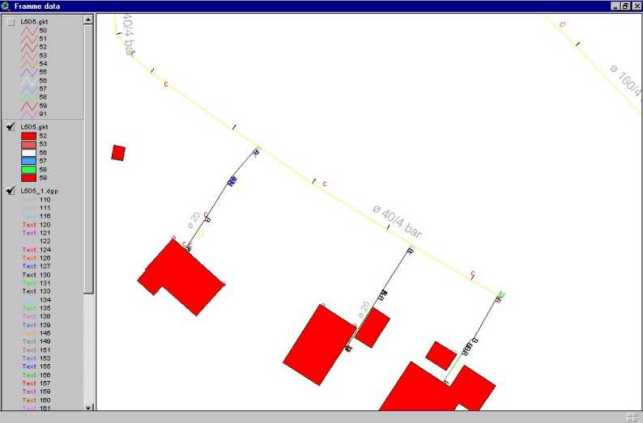
Figure 4. Typical contents of a Framme file, the housepolygons are added for reference. The datafile contains very detailed information on where gaspipes are located. All annotation are converted into points, and the symboltype and text is stored as attributes.
The data conversion has to be a fast and reliable process in order to be used as a basis for distributing the data in the organisation.
It was decided to use ArcView GIS to develop the conversion application for several reasons:
The conversion process is a multipart process (Figure 5):
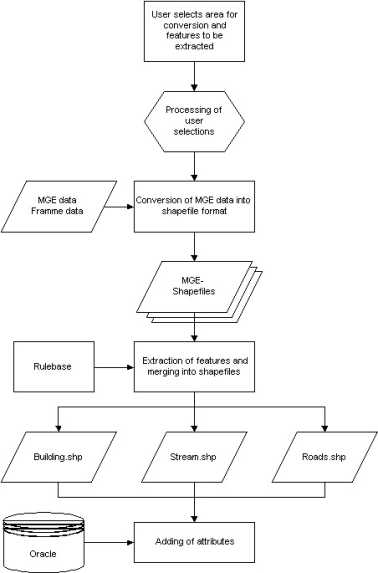
Figure 5. Overview of the conversion process
The first step in the conversion process is to select the files that need to be converted. There are several ways to select files for conversion, either by making a spatial selection in a map or manually selecting the files needed for conversion. In either way the result is a list of all the files that need to be converted.
After having selected the files that need to be converted the user select which features need to be extracted. There are some standard sets of features that often have to be extracted; these are predefined in the system and are easily selected through the user interface. Otherwise the user can select features from a list of all the different feature types stored in the database.
After the user selections have been made and all the parameters needed to make the conversion have been set, the actual conversion process is ready to be started. The rest of the conversion process runs unsupervised and the application can run for several days (even weeks) without user interaction.
The first step in the actual conversion process is to convert all the MGE/Framme files into shapefiles (these files will be called "MGE-shapefiles"). During this process the MGE files are split into 3 separate shapefiles, containing polygons, polylines and points (the annotation is converted to points) respectively. In order to optimise the conversion it was decided to keep the "MGE-shapefiles" between conversions (Disk space was not an issue) and then make a simple date/time check when performing the MGE->Shape conversion. This is done in order to see if an up-to date version of the "MGE-shapefile" already exists in the system or if it needs to be converted again. This date/time check reduced the conversion time with almost 40 percent because only a small number of MGE files actually changed between the conversions.
The larger the individual MGE-files are the more time can be saved by making such a date/time check. The number of files that have been changed since the last conversion was performed also has a significant influence on the overall processing time.
After this initial MGE->Shape data conversion has taken place it is time to make the output shapefiles according to the rulebases mentioned earlier. The rulebase is simply a set of rules stating which features are written to which shapefile (Table 2).
Table 2. Some of the rules in the conversion rulebase. These simple rules are the basis for the datastructure and naming of the resulting seamless layers.
|
Outputfile |
Featurecodes |
Featuretypes |
|
Building_Line.shp |
501 |
Building roof, |
|
502 |
Building wall |
|
|
Building_Polygon.shp |
501 |
Building roof, |
|
502 |
Building wall |
|
|
Streams.shp |
577 |
Stream 2,5-7,0 m |
|
580 |
Stream 7,0-12,0 m |
|
|
581 |
Stream >12,0 m |
|
|
Windmill.shp |
561 |
Windmill |
It was chosen to make a few themes containing a lot of related features instead of creating individual themes for the individual features. This means that one shapefile contains all the street centrelines, whereas another shapefile contains all the features related to buildings. Those feature types that are represented as both polygons and lines in the CAD-file (e.g. buildings) can be written to two different shapefiles, one containing building polygons and another one containing building polylines.
For each of the "MGE-shapefiles" the features are selected and written to the appropriate output shapefile. This merge process is the most time-consuming part of the conversion process, especially for polygon features.
New output shapefiles are created every time the conversion is run instead of using a spatial search and replace algorithm. The advantages of such a search and replace algorithm would obviously be some performance improvement due to the fact that only a few features actually have changed since the last conversion was made. The processing time with such an algorithm would probably not have been significantly smaller, beacuse of the amount of validation it would be necessary to perform.
After the merge process has finished the attributes are added. All attributes are retrieved directly from the Oracle database, based on the identification key provided by Microstation (MS-link, RB-primary and RB-secondary).
The resulting data are ready to be used by the data-viewer application because the data structure corresponds with the data structure defined in the data-viewer application initialisation file.
If data are to be delivered to a municipality or another customer, data are always delivered with a MapObjects LT based dataviewing application as well as an ArcView GIS projectfile allowing the user to easily view, query and print the data.
For both the ArcView GIS projectfile and the MapObjects LT application data are displayed according to a cartographic standard.
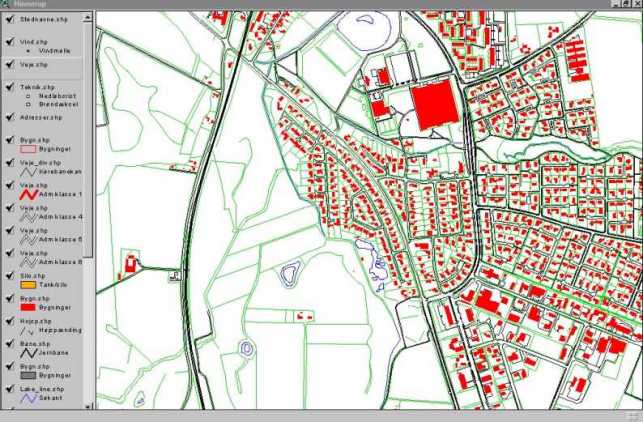
Figure 6. Presentation of the converted data. The data are displayed according to a cartographic standard. The data are delivered with a MapObjects LT based dataviewer and a an ArcView GIS project file ensuring that data are displayed in the same way regardless which application is being used.
The purpose of developing the data-viewer (SEGIS) was to replace the original HPGL based data viewing application. The SEGIS application is a stand-alone application intended for use in the field. The application allows the user to query and view the database through a simple user interface.
The application is essential to the people in the service and maintenance division when they need to locate a specific piece of pipe or a vent.
Besides the normal zoom, pan and query functionalities the application also contains an advanced redlining functionality (Figure 7). The redlining function serves a dual purpose:
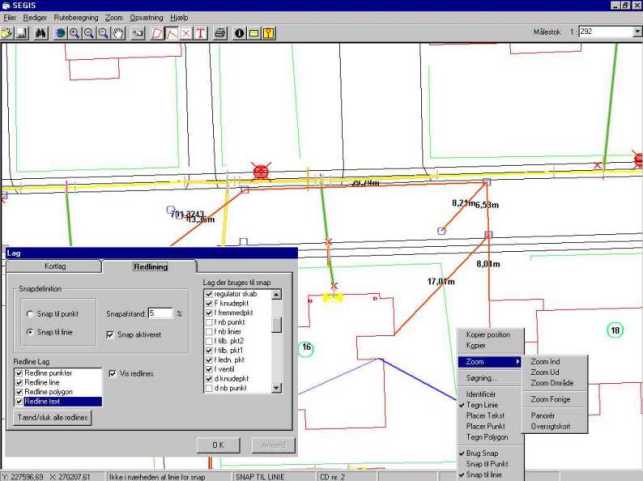
Figure 7. Screenshot from SEGIS showing the redlining functionality. The user has made some redlines to measure the distances between some well covers and some houses. The dialog to set-up the snapping environment is also open.
When using the redlining function the user can choose one or more layers and let the redlining tool snap to either vertices or lines in these layers (Figure 7). Redlines can be saved and loaded so that they can be exchanged, i.e. by email.
The application also contains a complete address database containing all addresses in the area, which allows the user to easily locate a specific address (Figure 8).
A simple routeplanning tool has also been included in the application allowing the user to find the shortest or fastest route between individual addresses.
Another very important functionality is the ability to print maps at specific scales (Figure 8). This is of great importance when using the printed map to locate a specific gas-pipe or a vent.
In order to be able to use the same symbols as used in Framme a special TrueType font has been made (Figure 8).
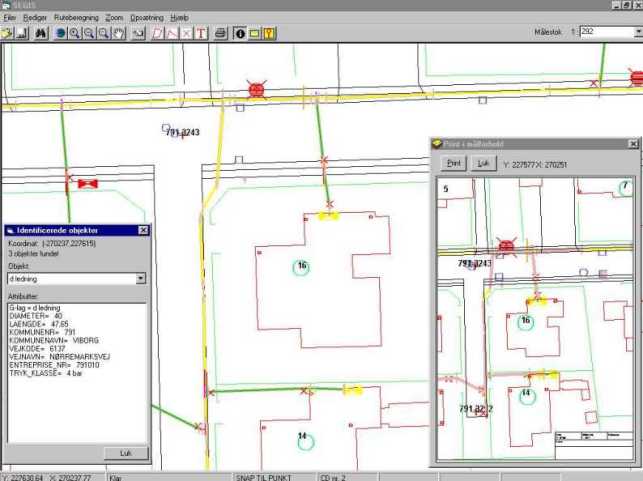
Figure 8. Screenshot from SEGIS showing the print to scale dialog. This is actually a form containing another a MapObjects control. The map is printed in the same scale as the map shown in the application. A TrueType font has been made in order to be able to display the data in a "Framme like way".
The development of the conversion application and the suite of data-viewing applications has shown the importance of a fast and reliable conversion tool being able to deliver data in a ready to use format. This provides all the data-viewers, which are used in different departments - and for different purposes, access to the same up-to date data. This is an important thing to consider when designing a new suite of data-viewing tools in any organisation.
Also the organisation benefits from the centralised editing and maintenance environment in the MicroStation and Framme system.
The authors wish to thank their respective companies for providing the opportunity to write this paper. Most importantly David S. Douglas at Naturgas Midt-Nord, who developed the SEGIS application are thanked for his corporation.
Rasmus Holm Jensen
Informi GIS
Maglebjergvej 6
2800 Lyngby
Tel: +45 28 00 00
Email: rasmush@informi.dk
Søren B. Andersen
Informi GIS
Maglebjergvej 6
2800 Lyngby
Tel: +45 28 00 00
Email: sorena@informi.dk
Vagn Gade Hyldgård
Naturgas Midt-Nord
Vognmagervej 14
8800 Viborg
Tel: +45 87 27 87 27
Email: vgh@midtnord.dk