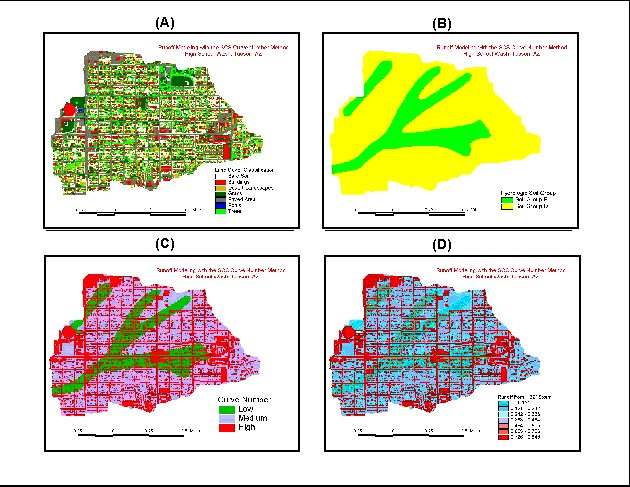
Figure 2. Series of maps showing the prediction of rainfall for an urban watershed using the SCS Curve Number Method. A land cover map (A) is combined with a soils map (b) to produce a distributed Curve Number map (C). Rainfall data is combined with the Curve Number coverage to simulate distributed rainfall, which is then area-reduced to predict total runoff depth for the watershed (D).