
Zoltan Der
Robin Grossinger
San Francisco Estuary Institute
Building a regional GIS requires integrated tools and techniques. The Bay Area EcoAtlas is a Geographic Information System of past and present local ecology of the bays, baylands, and adjacent habitats of the San Francisco Bay Area. It is designed to support regional environmental planning and management. The EcoAtlas was developed with a wide selection of database, GIS and graphics software on multiple operating systems functioning in a collaborative mix of science, government and public participation. Critical challenges (historical map compilation and registration, truthing, presentation, data exchange and documentation) were overcome using a combination of standard and custom processes.
This is one story (of many) about the development of a regional Geographic Information System called the San Francisco Bay Area EcoAtlas. This particular story is about the integrated tools and techniques that helped create the EcoAtlas. It presents one possible answer to the common question, how do you make a regional GIS?

The EcoAtlas is managed by the San Francisco Estuary Institute. SFEI is a non-profit organization created in 1994 as a result of the Comprehensive Conservation and Management Plan (CCMP) for the San Francisco Estuary produced by the San Francisco Estuary Project as part of the United States Environmental Protection Agency's National Estuary Program.
SFEI's mission is: to foster development of the scientific understanding needed to protect and enhance the San Francisco estuary through research, monitoring, and communication.
The San Francisco Bay Area EcoAtlas
is a Geographic Information System used to support local and regional environmental
planning and management. It is a view of the region's environmental past,
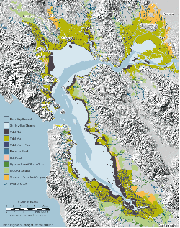 present,
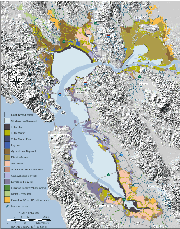 and change,
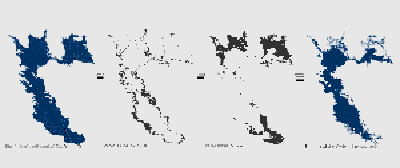 .
.
The atlas originally focussed on lands of the San Francisco Region which drained directly to the Bay, but it is expanding its scope to the full extent of the CALWATER San Francisco Bay Region and is adding additional spatial data layers.
In 1994, members of the Bay Area academic, science and government communities, along with interested members of the public defined a common objective: to establish goals for habitat restoration. This effort became the Baylands Ecosystem Habitat Goals Project. In effect, this combination of a constituency and a process, created a functional Geographic Information System: knowledgeable people working together to solve environmental problems.
But, this system would not be complete until it had the tools and techniques required to meet its goals. It had,
For these reasons, SFEI created the EcoAtlas.
The EcoAtlas was built with a large toolbox of tools and techniques.
Why did this toolbox need to be so large?
First, for any particular task, it was best to have multiple tool/technique choices available. During the Goals Project process, SFEI GIS staff were often in the position of defining unique solutions to new problems. There were no existing models to follow. How does one accurately register adjoining digitized United States Coast Survey T-Sheets? How are spatial feature data gaps in historical maps filled with non-map sources? How can large numbers of scientists without standard GIS tools participate in feature delineation and annotation?
The output of one tool's processes were sometimes not adequate for the input required by the next tool. For example, SFEI graphics staff discovered that EPS output from ArcView and ARCPLOT would not open as editable PostScript art in the common graphics applications used by many of the pre-press shops, newspapers, magazines and other organizations who received SFEI GIS-produced map graphics. Most of these shops had never heard of the industry-standard GIS map-creation tools, so SFEI graphics staff asked them about the tools they used most often. SFEI discovered that, most of the time, these shops were using Adobe Illustrator as their primary vector graphics production software. So SFEI researched the problem and discovered a useful Illustrator plug-in called, MAPublisher, which allowed them to import shapefiles directly into the application with all attributes intact.
Second, it was important to balance real-world tested tools and techniques with cutting edge ones. A good example of this thinking occurred during 1996-1998 as the first group of interactive web GIS tools were released. SFEI GIS staff considered many of these tools but found their on-line application building capabilities to be difficult and time-consuming to implement and their performance to be lacking. Staff relied instead on a mix of standard WYSIWYG HTML editing, database, and web-graphics programs to develop the EcoAtlas web site. Another example involved the creation of polygons from adjacent pixels with similar values in aerial imagery. SFEI GIS staff developed a custom process using Adobe Photoshop's magic wand tool, Illustrator and Esri's ARCEDIT which allowed them to quickly capture modern tidal marsh pans and riparian tree zones from infrared aerial imagery.
Third, the EcoAtlas could never have been developed without a mix of both manual (or analog) and digital tools and techniques. Manual tools and techniques were found to work best for,
Digital tools/techniques worked best for
SFEI used multiple operating systems to create the EcoAtlas.
The first EcoAtlas database was developed using a program called HyperCard. This application used a card-based metaphor for information display and was one of the first applications to utilize hyperlinks for navigation. In 1994, this program enabled the rapid development of a source and contact database to handle the large numbers of research materials which arrived daily in SFEI's offices. Much of the field research crew at that time consisted of student interns and volunteers. The EcoAtlas paid staff was small and had access to only two shared computers within SFEI's education department. The available resources demanded creative application development. The Hypercard database contained an extensive help system and, with its ease-of-use, allowed for a minimal learning-curve and maintenance schedule.
This database lasted for about one year and was replaced with a FileMaker application which shared the same RAD and user-interface features as HyperCard but had a more robust database-engine. During 1995, as the EcoAtlas coverages were beginning to be constructed using Esri's ARC/INFO software, its database grew to over forty related tables.
The FileMaker database was converted to a Microsoft Access database that was better able to deal with the emerging EcoAtlas relational design, was more common in partner GIS shops, and was a standard in other SFEI projects.
Currently all EcoAtlas ARC/INFO and Access databases are being considered for conversion through Esri's SDE to SFEI's main Oracle database. This will begin the process of unifying spatial and non-spatial data at SFEI into a common database and facilitate internal SFEI and external web-based data sharing.
The EcoAtlas GIS layers (or coverages) were created with Esri's ARC/INFO software - the industry-standard for GIS production. This application is the most reliable, heavy-duty application for the creation, editing and maintenance of GIS data.
Esri's ArcView is the Microsoft Word of GIS applications. All EcoAtlas partners doing GIS work had at least this program in their toolboxes. It allowed for rapid incorporation of completed spatial data sets into thematically related views. The EcoAtlas version 1.50 beta test CDROM was released in 1998 as an ArcView project with associated shapefiles, grids, registered aerial images, and documentation.
The EcoAtlas modern habitat features were truthed in 1997 using orthorectified 1:65,000 NASA infrared aerial images. PCI's OrthoEngine was the primary tool used for registering these images. SFEI GIS staff tested this software for almost one year before incorporating it into the EcoAtlas workflow.
LizardTech's MrSID software was used to compress and release mosaiced aerial images.
Finally, along with Esri's GRID and other raster editing and display applications, SFEI used Adobe's Photoshop for quick and powerful image manipulation.
Esri's ARCPLOT was used for many of the first series of EcoAtlas maps. It allowed for database-driven map updates and was easily automated using the Arc Macro Language.
Esri's ArcView was used for quick map layouts and was ideal for small-format maps used in reports and other documents. It is currently being used for preparation of large-format 1":150' scale watershed aerial image basemaps used by field-staff to identify landslides and other geomorphic process.
Adobe's Illustrator with Avenza's MAPublisher allowed easy incorporation of spatial data (through shapefile and registered TIF image import) into cross-platform universal Encapsulated Postscript format files. Because a minimum of new concepts and software skills were required, the existing SFEI graphics production team was able to integrate with the GIS team's workflow very quickly.
Any GIS shop producing large-format maps in-house will need good quality Raster Image Processing (RIP) software. SFEI's GIS shop settled on Handmade Software's ImageAlchemy after trying a number of alternatives. While, RIP software and dedicated hardware can be very expensive - approaching ten thousand dollars in cost, ImageAlchemy is a relatively low-cost solution with a robust PostScript ripping engine and the ability to convert between many common image formats. Its only drawback is a lack of a Graphical User Interface.
EcoAtlas production techniques helped bridge the gap between tasks, tools and systems. On the input end, information was researched, assessed, compiled, integrated and truthed. On the output end, common digital data files, paper and plastic products, and internet documents were released.
 Large
teams of SFEI staff performed extensive research at libraries, historical
societies and museums, and consulted local experts and elders who could provide
useful information about the landscape. Field crews surveyed and sampled landscape
habitat, geomorphic processes, and land-use. Sources and contacts were cataloged
in a database.
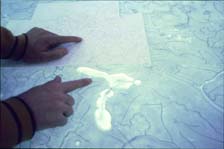 Assessment
answered the question - is the researched material valid for the study purpose?
Collected sources and data were compared to other sources and data with similar
themes and areas of interest. An objective evaluation of certainty
(the potential error of a map feature's presence, size and location) resulted
from these comparisons.
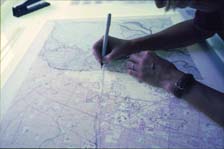
Valid materials and data were compiled into geo-referenced maps and associated information. Material types included maps, images, reports, atlases, recordings, field-notes, oral-histories, and articles. The maps had different themes, scales, projections and extents which had to be merged into common mylar stable-base maps at 1:24,000 scale.
 All
spatial data was integrated into the EcoAtlas by being converted into
digital formats, spatially referenced and/or registered, and given a common
set of parameters. Area features had an acreage attribute. All features
had habitat, feature, certainty and record-tracking attributes.
Spatial and non-spatial tables were related in a common database design. Feature
error was assessed, quantified and displayed. The large number of people participating
in the EcoAtlas and Goals Project process required extensive collaboration on
consistent and meaningful feature symbolization in both printed and digital
maps.
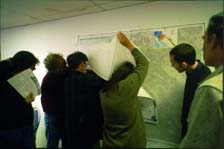 The
truthing stage occurred throughout the previous four steps. Field experts
corrected map feature shapes, locations and attributes. Their input was quickly
integrated into new versions of the EcoAtlas, often on a daily basis.
The EcoAtlas helped create a number of information products.
Digital data was released to partners via common file formats like ARC/INFO export files, ArcView shapefiles, TIF/tIFW and MrSID registered aerial images, Access databases, and comma-delimited flat files. The geo-referenced digital data was released in the most common regional and state projections and datums: NAD27 and NAD83 datums with the UTM Zone 10 projection; the NAD27 datum with the Teale Albers projection, and the Geographic coordinate system in decimal degrees.
Paper and plastic products included maps, documents, posters, slides and CDROMs.
The SFEI EcoAtlas web and FTP sites delivered narrative and metadata documentation in HTML, PDF and plain text formats; image data in GIF, JPEG, and MrSID formats; and data query and viewing applications.
In the future, the EcoAtlas will continue to evolve.
It is currently incorporating new layers of regional and local information. These include,
It will continue to provide accessible information to all potential audiences.
This has been a general description of one aspect of the making of a regional Geographic Information System called the San Francisco Bay Area EcoAtlas. Any Geographic Information System has a much better chance of succeeding if it has a range of tools and techniques which are able to support the research, communication and decision-making of knowledgeable people working together toward a common goal.
Graphics: San Francisco
Estuary Institute
Photos: Elise Brewster
Zoltan Der
Geographic Information System Analyst
San Francisco Estuary Institute
180 Richmond Field Station
1325 South 46th Street
Richmond, CA 94804
510-231-5791
510-231-9414 (fax)
zoltan@sfei.org
Robin Grossinger
Assistant Environmental Scientist
San Francisco Estuary Institute
180 Richmond Field Station
1325 South 46th Street
Richmond, CA 94804
510-231-5742
510-231-9414 (fax)
robin@sfei.org