Arwyn Jones
The European Statistical Office (Eurostat) collects a number of attributed spatial datasets relating to transport: roads, rail, air, navigable water and ports. These themes reflect the major transportation infrastructures of the European Union. In addition, their databases contain information on the proposed Trans European Networks (TEN). The TEN are proposals for a sustainable and integrated European transport infrastructure which gives the possibility of rapid transit of people and goods between the member states on the basis of key access points and high speed connections between the various nodes of the network. The spatial analysis being undertaken by this study is concerned with defining and developing a regional index of "transportation richness" which takes into account the proximity and diversity of various transportation methods within the European Union. The effect of these networks on the environment and population will be presented and assessed in light of developing transportation policies. This study is part of a series of case studies being undertaken by the Joint Research Centre to develop a range of spatial analysis techniques with Esri ArcInfo and ArcView Geographical Information Systems (GIS) to problems which are typical of those encountered in the work of the European Commission. The work is being carried out in support of the GISCO Unit of Eurostat.
A number of studies have already been made on the application of spatial analysis to transportation networks. In particular, much emphasis has been placed on assessing the environmental impacts of various forms of transportation on issues ranging from the erosion of protected sites, noise levels, pollution from transportation systems and bottlenecks in flows to the designation of tranquil/wilderness zones. The spatial analysis described in this paper is concerned with defining and developing a regional index of "transportation richness" which takes into account the proximity to, and the diversity of, various transportation networks.
The goal of the Transportation Richness Index (TRI) was to develop an indicator that described areas with high levels of access to a range of transport networks. Accessibility to a transport network are scored according to distance time (and thus, indirectly, travelling time). Areas closer to an access point have a higher score than those further away. Thus, if an administrative region contains a motorway junction, that area will score higher than one that is further away from the motorway network while the areas outside of the buffers will not be scored at all. In a similar manner, a region that contains a major international airport will be clearly at an advantage over those that have none and therefore may need to travel considerable distances in order to make use of the network.
Such issues can affect the economic viability of regions. Increased transportation costs, the viability of moving perishable goods and traffic congestion are all factors that affect regional economies. As the Transportation Richness Index should reflect the diversity of transportation modes for the local population, the TRI will clearly identify such under-developed areas. However, the planning of new transport networks or access points need to consider other factors such as the environmental impact of any proposed developments. Consequently, the products derived from this study (i.e. the accessibility maps and the TRI) should be evaluated to assess both their benefits and their potential damage to the environment.
The work described by this paper was undertaken as part of a support activity to the Statistical Office of the European Union (EUROSTAT). The scope of this support activity was to raise awareness within the staff of the European Commission (EC) of the benefits of using geo-referenced data and statistical information which has been amassed by EUROSTAT and also to assess the suitability and usefulness of these data in support of spatial analysis.
The first step in achieving a transportation index was to develop a series of buffers around access nodes to a particular transport network that identified those areas within a specified distance. These buffers were subsequently scored according to the distance from the transport node. The TRI was calculated by combining the various accessibility datasets, weighted according to the perceived importance of the transportation mode and nature of the transportation required (e.g. freight, people). The following sections describe the development of the TRI in more detail.
The GIS Unit of EUROSTAT, GISCO, hold data on a wide variety of subjects, ranging from topographic data and administrative regions to a range of information on environmental and natural resources. For these subjects, several geograhic and attribute datasets are maintained. Consequently, the starting point of this study was to investigate the contents of the GISCO database with a view to identify transport related coverages that could be matched to the major transport networks of Europe.
In order to reflect accessibility issues in a realistic manner, potential data sets had to include some indication of access points to the particular transport network. As an example, the fact that a railway line passes through an administrative area does not necessarily mean that the population of that region has good access to trains since not all localities have stations! Consequently, in order to analyse the accessibility to a railway network, only information on the location of stations should be considered.
For some themes, the issue of access points is clear: for example, access to an aircraft is always via airports, motorways are only accessible via junctions. However, during the investigation of the GISCO database, an attempt was made to see whether "new" sources of information could be generated on the suited the need of this study. These new sources of information could be used to supplement the existing transportation information contained within the GISCO database. Consequently, any potential themes had to contain sufficient attribute information (associated with the digital cartographic data) that could be used directly, or through some spatial processing, to designate access to a transportation system.
On the basis of these investigations, five basic transportation infrastructures were identified for both pan-European and the TEN networks: these being:
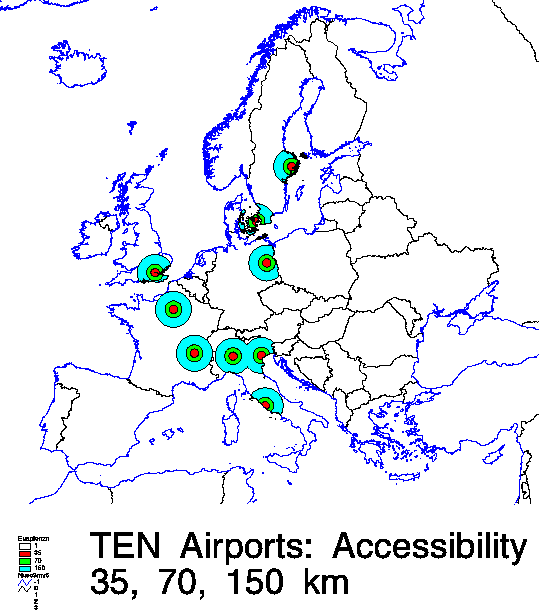
For each of these networks, one or more coverages were identified as suitable candidates for the generation of accessibility maps. The TEN (Trans European Networks) are proposals for a sustainable and integrated European transport infrastructure that gives the possibility of rapid transit of people and goods between the member states on the basis of key access points and high speed connections between the various nodes of the network.
The selected themes and their corresponding coverages are outlined in the following table. The coverages indicated in bold italics are "new" coverages that were generated specifically for this study by adapting the existing GISCO coverages. The coverages indicated in italics are a sub-set of standard GISCO coverages (this implies some level of pre-processing prior to use in the generation of access maps).
|
Transport Network |
Pan-EU Coverages |
TEN Coverages |
|
Air |
Pan Europe Airports |
Airports |
|
Sea |
Main Ports |
Ports
Ferry Ports |
|
Roads |
"Euro Routes" (arcs)
Motorways (arcs)
Main Motorway Access |
Proposed Network (arcs)
Main Access Points |
|
Railways |
Main Railway Stations
Border Stations |
Main Railway Stations |
|
Waterways |
Navigable Inland Waters |
Navigable Inland Waters |
This discussion does not extend to the data on Ports and Navigable Inland Waters that could be used as they were. Most of the TEN datasets could also be without any additional processing since the volume of information is less and the layer does not extend beyond the boundaries of the EU. Exceptions are the access datasets for the TEN Roads and Railway Stations.
A similar approach was required for creating the required information on railways. The railway coverage is a line coverage with an attribute file attached to the nodes (.NAT). The NAT file contained an item which described the type of railway stations as border stations or stations within the country. By selecting on the code "BS", 299 records were extracted. These records were used as the border railway stations coverage.
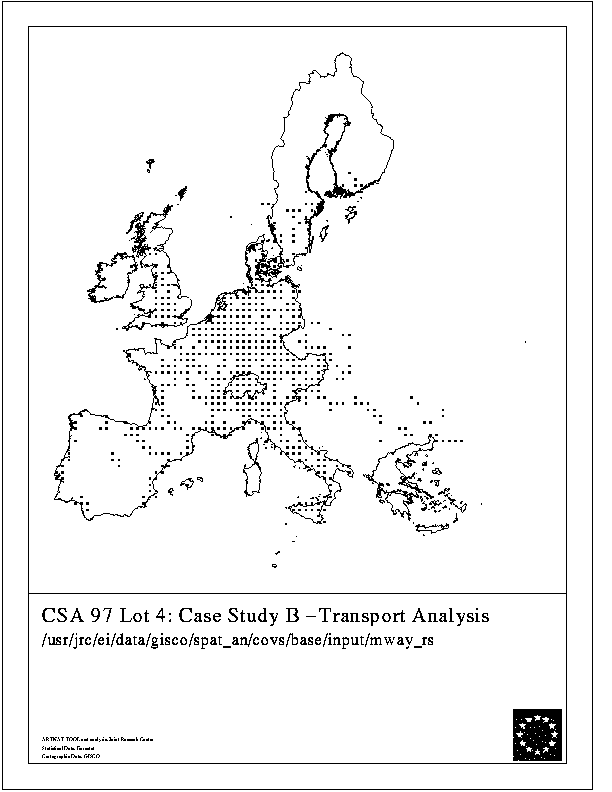
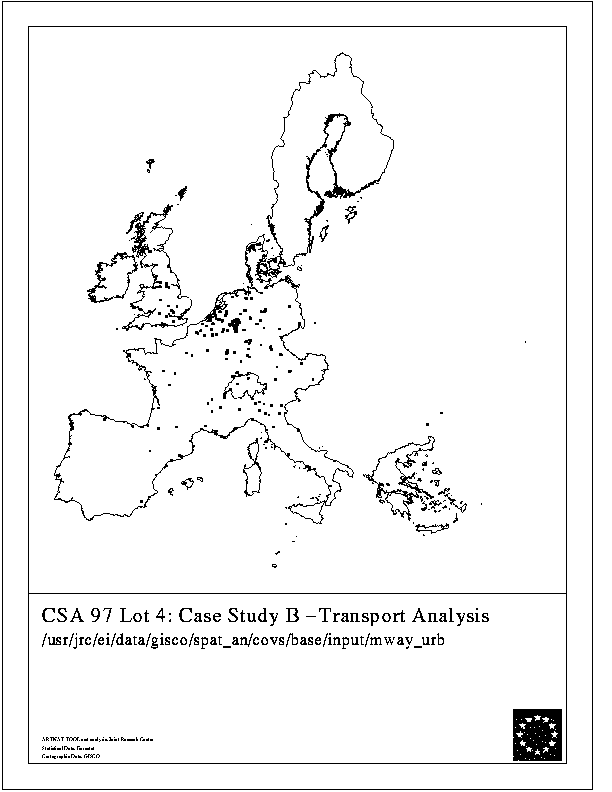
The identification of access to the road network was a little more problematic due to the size and complexity of the European road network. The pan-European road network dataset in the GISCO database is a comprehensive depiction of the road infrastructure across Europe. The line information has been coded to identify varying classes of roads (i.e. EuroRoutes, Motorways, Trunk Roads, A Roads and Ferry Crossings). Given the somewhat limited resources associated with this project, it was decided to focus only on EuroRoutes and Motorways. In addition to the normal point access data, it was decided that the line elements of the road datasets should be investigated. This is due to the ease of access to the road network compared with other modes of transport. Consequently, two linear road coverages were created for EuroRoutes and Motorways by simply reselecting arcs by the appropriate coding.
Such an approach was used to create a new coverage on Ferry Ports. The GISCO database contains a dataset on ferry links. This is a line coverage (arcs) that depicts sea routes between certain ports. In its original mode, this coverage does not offer much scope for accessibility studies. Consequently, an attempt was made to automatically generate a set of points that marked the end of the ferry routes (i.e. ports).
A similar approach had to be adopted for producing a main railway station dataset. Investigations of the coverage and attribute information showed that there more than 30,000 nodes on the linear data were classified as railway stations. In order to create a data set that could be processed by the Arc/Info buffer program, the following approaches were adopted:
The second step in deriving a transportation index was to develop a series of buffers around access nodes to a particular transport network that identified those areas within a specified distance. This section outlines the basic methodology used to generate these accessibility maps.
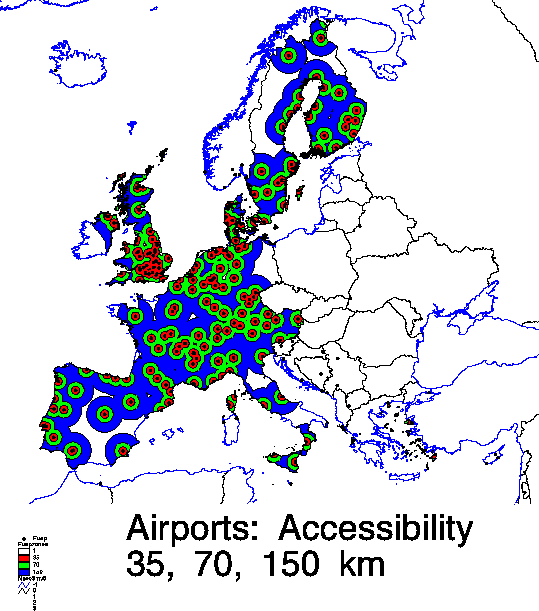
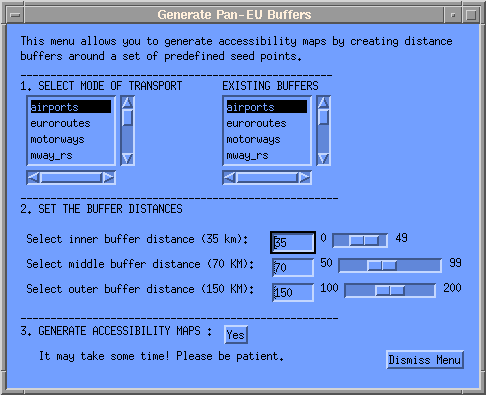
For the purposes of this study, a set of buffers were generated using the ARC BUFFER command. The buffers were calculated for 35 km, 70 km and 150 km distances from a set of "seed points". These distances correspond to approximate travelling time for car based journeys made within the European Union of 30 minutes, one hour and two hours. These resulting buffers were subsequently scored according to the distance from the transport node and merged into a single coverage.
It should be stated that although the buffer distances used in this study were fixed and, to a degree, slightly arbitrary, it is a simple exercise to repeat the methodology for other analysis with revised distances, more detailed data and more sophisticated buffering approaches (see conclusions). In fact, a user interface for setting the buffering distances was developed using AML menu commands.
A number of interesting features can be identified from the simple visual analysis of the various accessibility maps.
The airport accessibility map shows that virtually all of the EU is within 2 hours drive of a civil airport. The map clearly identifies the reduced level of such facilities for the Mediterranean countries compared to the northern European countries. The UK in particular has high levels of accessibility to airports.
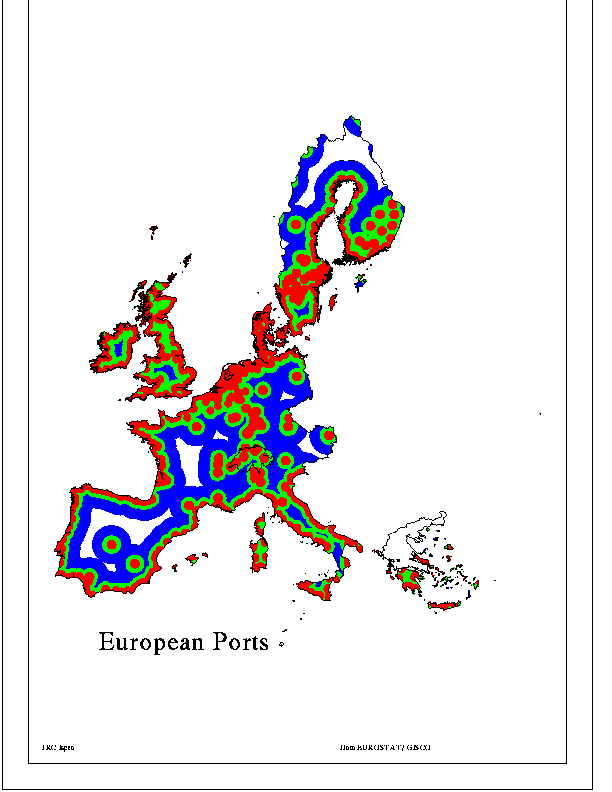
The ports map clearly illustrates, as expected, that the accessibility patterns mirror the European coastline. Again, much of Europe is within 2 hours of a port with the central regions of France, Spain and Germany loosing out. It should be noted that the map does show that northern Sweden has some access to ports on the Arctic Ocean and that some "inland" ports have also been included. The TEN ports map shows an almost identical pattern along the coast but the number of ports is significantly lower and no inland ports are included. The ferry ports map shows a similar pattern. Although, Denmark, the UK, Italy and Ireland are comprehensively covered due to their island or peninsular shape, most of inland Europe is removed from most ferry ports.
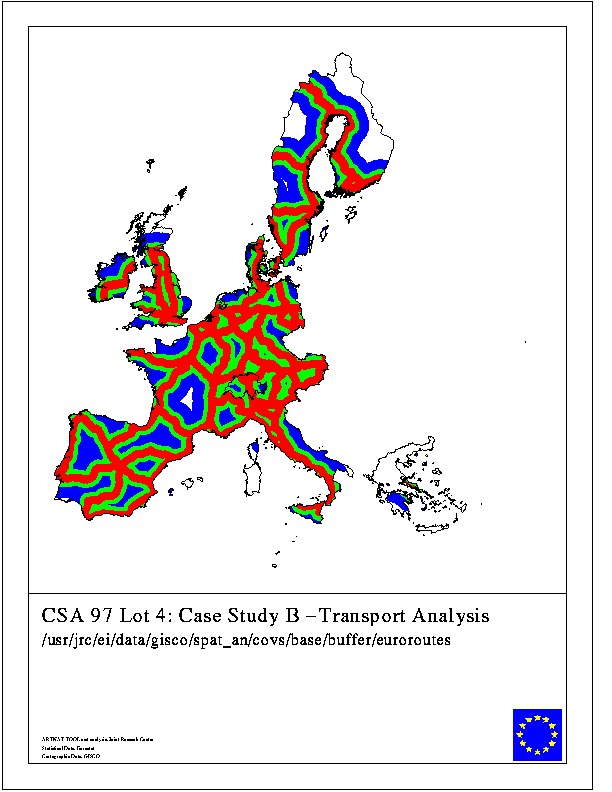
The road maps illustrate clearly the structure and density of the EU primary road network. In all cases, virtually all of Europe is within two hours drive of a EuroRoute or a motorway. Germany, the Benelux countries and the UK have very high access levels that reflect the high population densities of these zones. Some interesting patterns do stand out form these data most notably the limited development for south-west Spain, south-central France and the clear linearity of the north-south motorway system in Italy.
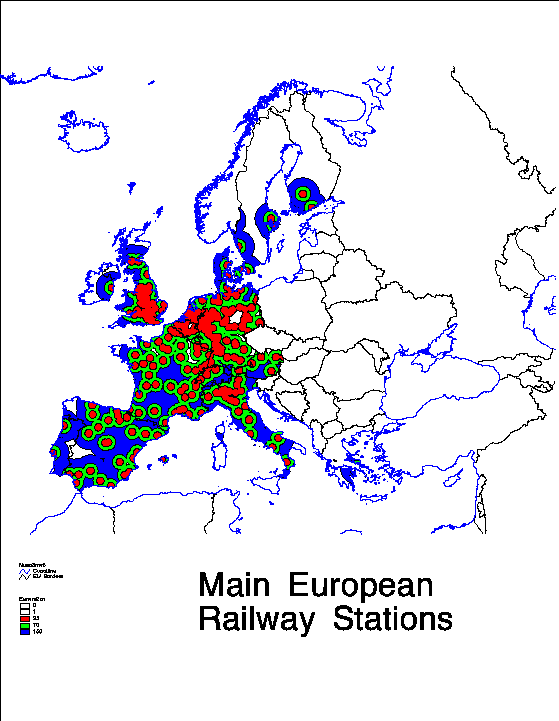
The patterns of the railway stations maps clearly illustrate that the majority of Europe has excellent access to the rail network. Exceptions are western Spain, western Ireland and the Baltic countries. However, the map may also be influenced by the location of major urban areas due to the necessity of clipping the railway coverage with the urban mask in order to reduce the data volumes. Hence the patterns for Ireland where the population of the western towns fall below the threshold of the urban mask. The border stations map is also an interesting product as it shows the accessibility to services for the populations of one or more countries. This element becomes increasingly important with the removal of internal borders within the EU.
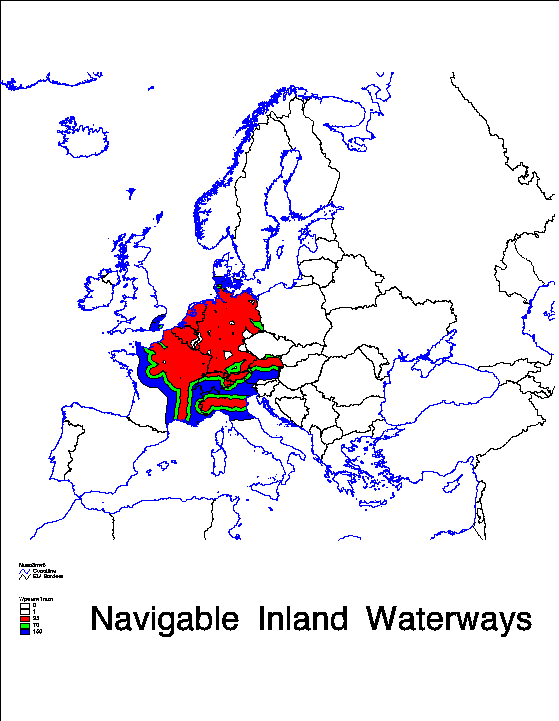
The navigable inland waters maps clearly show the heavy use of river transport in France, Germany and the Belelux countries. Obvious patterns include the Rhine, the Rhone, the Po (surprisingly also the upper reaches are marked as navigable!) and the canal systems for France, Holland, Belgium and Germany. The TEN map depicts essentially the same network but much simplified. The navigable extent of the Po has been reduced and a number of Portuguese rivers have been added.
In summary, the TRI is calculated by combining the various accessibility datasets described previous chapter, weighted according to the perceived importance of the transportation mode and nature of the transportation required (e.g. freight, people) and summed. Areas with a high index should be associated with good access to many transport networks.
The various accessibility (buffer) polygon coverages were converted to a 10 km grid cell using the value contained in the accessibility scoring attribute. This created a raster image where each cell value corresponded to the access scoring. A number of considerations had to be observed when creating these grids:
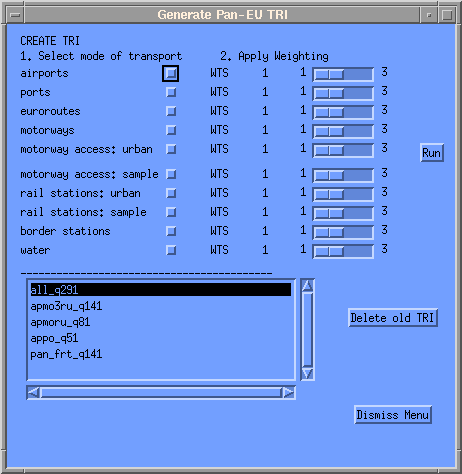
Once the grids were created, an AML applications was created to generate the TRI data. This original and innovative application allows the user to create the TRI by selecting any combination of data and upto three levels of weights. The weighting was applied by multiplying the selected data by the relevant factor (i.e. 2 or 3). After all weightings had been calculated, the selected grids were summed within within GRID. Cells with the highest values would have resulted from the addition of high values from the accessibility buffers (and consequently, good access).
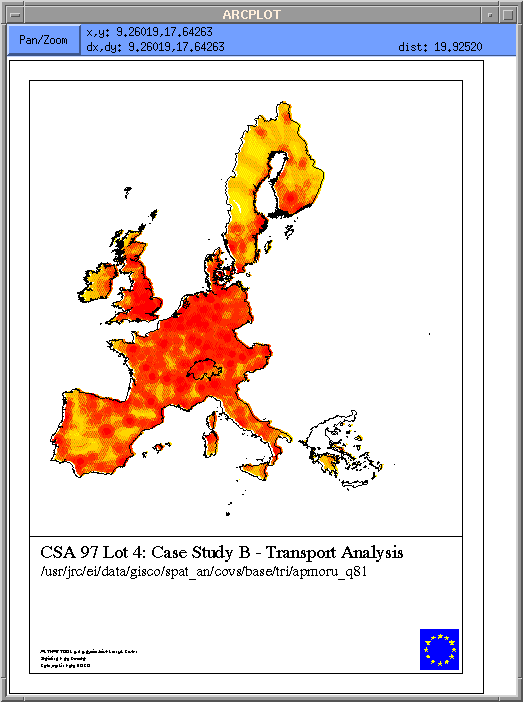
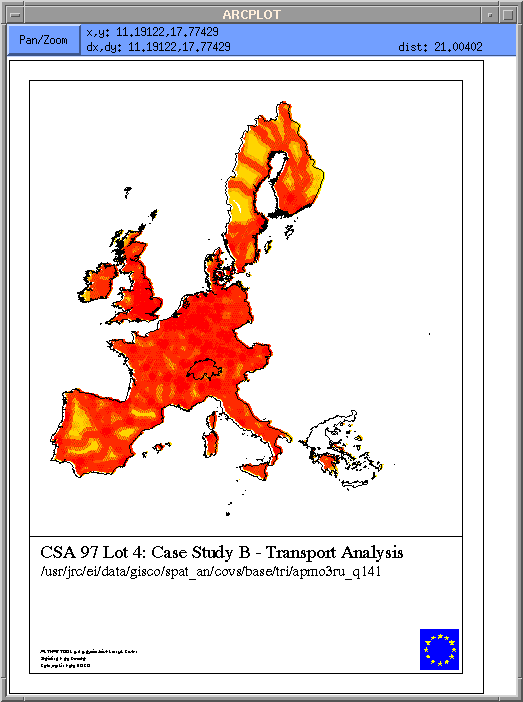
The image on the left shows the TRI for airports, motorways and railways (urban mask) while the image on the left uses the same input data but with higher weighting applied to the roads (see Scandinavia).
The relevant GISCO datasets relating to the generation of the various transportation indices were identified and their suitability for use in the analysis confirmed. The attributes of the selected themes were also investigated and suitable parameters selected for calculating the various indices identified.
In these analyses, it was decided to retain the "seed" information for areas outside of the EU. This was done as these nodes may well provide access to transportation networks for people living in surrounding EU member states (e.g. Lugano airport in Switzerland serves many people living in northern Italy, the same for Oslo, etc.). Consequently, the exclusion of information relating to outside of the EU is done only at the completion of the buffering exercise (i.e. it is the buffers that are clipped). In this manner, some communities living on the peripheries of the EU made be shown as being close to a particular node without the source node being obvious.
It should be stated that a number of problems were experienced with various ArcInfo commands during the creation of accessibility maps. The BUFFER command would not run when attempting to buffer large numbers of points (e.g. the railway stations coverage contained 30,001 seeds and could not be buffered). The UPDATE command, which was used initially to merge the three buffer zones (later use was made of IDENTITY), did not work consistently, particularly with large or complex polygons.
A distinct element within the project was the development of a software support tool for the ArcInfo environment using the Arc Macro Language (AML). ArcInfo and AML were selected as they provide a robust, stable and tested environment to develop an application to undertake the degree of processing described in this paper.
The ARTNAT application is composed of almost 50 AML scripts consisting of more than 2400 lines of code. Extensive use has been made of menus and AML graphical elements in order to develop a visually driven user interface.
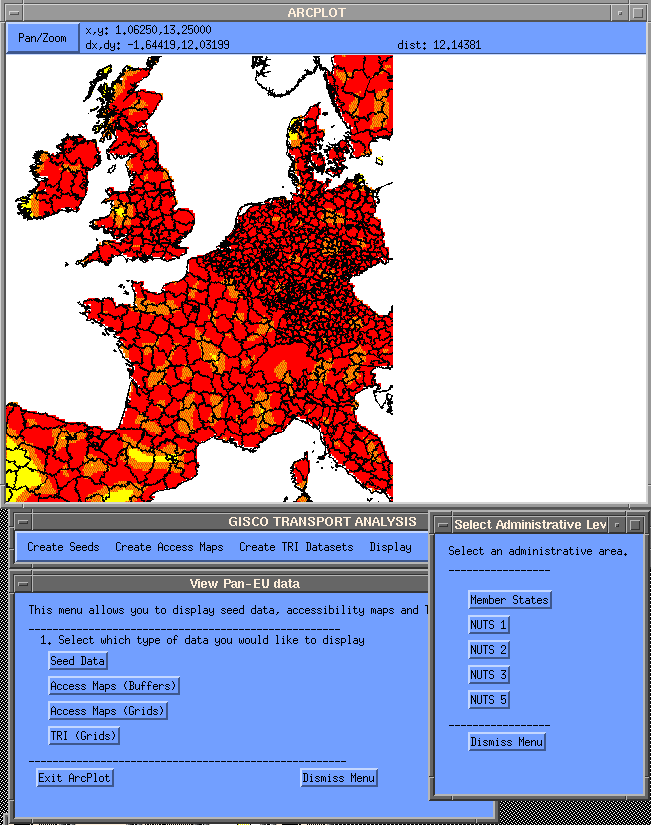
The application allows users to generate datasets that can be used as seed nodes for accessibility mapping (i.e. buffering). The tool generates accessibility maps for a range of themes with varying buffer distances that are displayed in colour. Access zones can be set interactively by the user.
Various transportation indices (including the TRI) can be generated "on-the-fly" or visualised directly. The TRI interface permits the user to select any number of access data sets and apply weights as appropriate.
It is possible to zoom in to any level to view complexities in greater detail. The application allows the user to overlay the original seed data and a range of ancillary information (e.g. elevation, rivers, administrative boundaries, protected areas, socio-economic data). The tool allows the user to extract region and commune level data for any area.
The tool also allows the generation of Encapsulated Postscript files for the production of A4 colour plots for all data associated with the TRI maps.
It is important to note that the application uses actual data from the GISCO databank. In this manner, any modifications to the underlying information can be read by the programme and updated indices easily generated.
The following images show a number of examples of the ARTNAT user interface (bufer manager, TRI generator and visualisation tools).
The main results of the study are summarised below.
The author gratefully acknowledges the valuable comments received from colleagues both at the JRC and the GISCO office (in particular, Robert Peckham and Josefine Oberhousen). All maps reproduced in this paper are based on information contained in EUROSTAT's GISCO database.
Time and Space Modeling of Public Systems Using the New Features of the ARC/INFO Version 7.1 ARC NETWORK Module. Per Thorlacius, National Environmental Research Institute, Denmark. Proc. Esri User Conference, 1998.
Transportation and Infrastructure Management. Garyn Perrett & Todd Hougaard, SmartMap Systems LLC, USA. Proc. Esri User Conference, 1998.
Transportation Model/GIS Integration. Kevin Thomas & Dustin Montoya, Denver Regional Council of Governments, USA. Proc. Esri User Conference, 1998.
Arwyn Jones
European Commission
Joint Research Centre
Environment Institute
TP280
21020 Ispra (VA)
ITALY
Tel.: +39 0332 789162
Fax.: +39 0332 789256
arwyn.jones@jrc.it