Brian Welde, M.A.
University of Missouri-Columbia Geography Department
Project Manager Spatial Data Research
Edward Kinman, P.H.D.
University of Missouri-Columbia Geography Department
Timothy Haithcoat, M.S.
University of Missouri-Columbia Geography Department
INTEGRATING GIS WITH DISPERSION SOFTWARE TO DETERMINE THE EQUITY AND RISK OF AIR POLLUTION IN EAST ST. LOUIS, ILLINOIS
Disparate pollution, in terms of amount received, type received, and by whom, has been studied for three decades. Born out of the environmental justice movement, research has generally focused on the effects of singular facilities and their relationship to demography. These works have used the spatial analysis capabilities of Geographic Information Systems (GIS) primarily to create circular buffer zones of assumed exposure to assess potential harm. Pollution, however, is not uniformly distributed, nor does the pollution potential of a singular facility provide a complete understanding of exposure risk in an area with multiple polluters.
Due to criticisms of many early environmental justice studies, the Environmental Protection Agency (EPA) formed an environmental equity workgroup in 1992 to examine research deficiencies. They determined research generally lacked information on health risks posed by multiple industrial facilities, cumulative and synergistic effects of pollutants, and multiple and different pathways of exposure (Schierow 1992). To remedy this situation, the EPA identified areas of the country where disparate pollution conditions exist and began funding work to address these problems. The study presented here represents one of those efforts, being supported by the EPA�s Gateway initiative for East St. Louis, IL.
For East St. Louis, understanding the possible synergistic and multiplicative effects of pollution is critical. Over 70 industrial facilities � including oil refineries, chemical companies, steel mill, commercial waste incinerator, five hazardous waste landfills, as well as copper, lead, and zinc smelters � are located within the incorporated area of East St. Louis (EPA 1997). Because of industrial emissions, the area does not meet health-related air quality standards for ozone and lead. Further, ambient air concentrations for cadmium are among the highest in the country (EPA 1997).
This paper is a brief overview of work conducted at the University of Missouri that examines the applicability of integrating dispersion modeling software with GIS to illuminate generalized trends of accumulative pollution and toxicity. We will first analyze the salient factors involved in the selection of the modeling software before proceeding to a discussion of the acquisition of geographic and attribute data. Next, the methods employed in manipulating the data are presented followed by a presentation of results and a conclusion.
Model Selection
Deciding upon the appropriate modeling software was the first step of the project. Factors considered in the selection process include the nature of the problem being modeled, averaging time, domain characteristics, and computational facilities. The Climatological Dispersion Model 2.0 (CDM2), was chosen based on these factors.
East St. Louis�s air pollution is characterized primarily by multiple industrial point and fugitive releases. Pollutants are particles of various sizes and differing chemical compositions. CDM2 is an EPA preferred model that utilizes the Gaussian plume hypothesis, which is a widely recognized means for determining airborne dispersion. Estimation of accumulative air pollution in the East St. Louis area also necessitates a large number of pollutant receptors. CDM2 is applicable for both point and area sources and can incorporate an unlimited number of user-defined receptor locations (Zannetti 1990).
Averaging time is a temporal measurement control. EPA Toxic Release Inventory (TRI) data, the source of information on emissions, are available as annual sets. This data source was utilized to derive estimates of pollutant mass released during a one-week period. One-week was felt to provide a more consistent approximation of pollution levels within the community. CDM2 processes annual weather conditions and user defined release amounts to calculate dispersion.
Domain characteristics refer to the natural and fabricated environmental qualities of the study site. East St. Louis is an urban area located on the Mississippi River floodplain. Many industrial complexes are located outside of the city. The city is void of compact and high rise structures. CDM2 is an appropriate choice as it is applicable for level terrain and urban areas (Zannetti 1990). It is programmed to model the effects urban cost surfaces have on dispersion, which impede the movement of effluent by interception of pollutants.
CDM2 is a FORTRAN computer language program that is able to run on DOS. Spatial analysis of the CDM2 results requires the use of Arc/Info. The Geographic Resources Center at the University of Missouri-Columbia has computer facilities that were applicable to these tasks. Also important in choosing CDM2 was the supply of weather information and processing models available from EPA�s Support Center for Regulatory Air Models (SCRAM) (EPA 1998b). CDM2 requires a weather data file in order to model receptor pollutant concentrations. The Meteorological Processor for Regulatory Models (MPRM) creates this file by processing yearly weather conditions for the modeling area.
Data Acquisition
Determining the appropriateness of data was the first step in the acquisition process. This involved evaluating sources for their strengths and limitations. In addition to spatial data, this project required detailed information on various polluting industries and the toxicity of the chemical agents being released into the atmosphere.
GIS coverages came from two websites. The Missouri Spatial Data Information Service (MSDIS) provided county, block group, and road vector coverages for Franklin, Jefferson, St. Charles, St. Louis City, and St. Louis counties in Missouri, and Madison, Monroe, and St.Clair counties in Illinois. A point coverage was also obtained from the EPA that contained the locations of EPA regulated facilities for the study area.
Acquisition of industrial data was a multi-step process. Initially, a list of polluting facilities came from a ZIP code search of the EPA�s TRI database. Each identified facility was then screened according to three criteria. First, it had to emit at least 8000 pounds of air pollution per year. Test runs of CDM2 employed with less than this amount produced negligible concentrations. Second, due to time constraints, the released pollutants must be from a point source. CDM2 can calculate non-point, commonly referred to as fugitive, sources, but point source calculations are more straightforward. Third, CDM2 has a modeling range of 25 km. A facility must not exceed this distance from the boundary of East St. Louis. This screening process yielded 46 industries.
Before the CDM2 modeling could be run, data on the height and width of stacks, pollutant exit temperature, and pollutant exit velocity were needed. This information came from the EPA and the Illinois Environmental Protection Agency (IEPA). Unfortunately, the IEPA did not have information for all of the industries in Illinois. Additionally, the Missouri Department of Natural Resources (MDNR) did not provide information on any Missouri sites. Therefore, these facilities were dropped from the analysis.
Some industries fell within the above guidelines, but during processing, reported no output concentrations. These industries were additionally eliminated from the project. After all of the selection and screening processes, a total of 14 sites were included in the model (fig. 1).
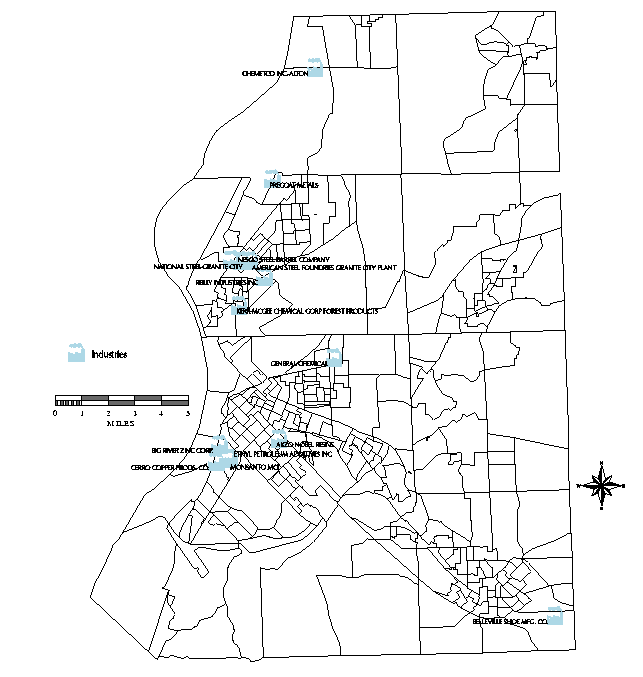
Figure 1. Industries contributing to concentration/toxicity results.
Information on chemical toxicity was obtained from the 1994 National Industrial Occupational Safety and Health (NIOSH) guide. This reference provides a listing for each chemical and its minimum exposure limits in micrograms per cubic meter. By taking the inverse of this number, multiplying it by the percentage that each chemical contributes to a total release amount, and then adding all such results for all contributing chemicals, a weighted average toxicity (WAT) may be obtained for the entire release (Scott and Cutter 1997).
Methodology
Generating a model to depict comprehensive air pollution requires several data manipulations. This section will first explain the operation used to generate receptors for each industry and a brief description of the modeling assumptions employed. Next, the transformations required to generate plumes will be presented, followed by a discussion of data display.
In Arc/Info, each industrial pollution source was represented as separate point coverages. A horizontal line, drawn through the location point, served as a reference for the addition of ten test points spaced in 2500 meter intervals. Concentric circles were drawn from the industry point to each test point. Receptor points were then added on each ring that were N, NE, E, SE, S, SW, W, and NW of the industry point. CDM2 was then run using the newly established receptor points for every industry, generating pollutant concentrations for each.
CDM2 allows the user to choose one of seven schemes for characterizing vertical dispersion downwind of the source (Irwin, Chico, and Catalano 1985). The algorithms used are functions of downwind distance and atmospheric stability and allow the user to more accurately model dispersion in urban or rural areas. Urban, urban fringe, and rural industries contribute to East St. Louis pollution. The Pasquill Gifford Climatological Dispersion Model (PGCDM) scheme can be used to approximate point source dispersion in these terrain types. Additionally, the user must make selections for several other variables affecting pollutant dispersion: stack downwash, plume rise, buoyancy effects, and initial dispersion. PGCDM was run alone and in combination with these other variables. Including all variables allowed for a slightly greater concentration in results than if none of the options were used or each was used singly. This approach was chosen for all processing. Possible overrepresentation is acceptable in this project for two reasons. As mentioned previously, the sources used in this research represent a sub-set of the possible total pollution. Therefore, over representation is occurring of under represented data. A second reason is that analysis is trend based focusing on fallout patterns produced. Unless a significant loss of concentration was to occur, the general fallout trends for the area should not change.
Plumes were generated by additive concentration of pollutants. To accomplish this, the receptor points were encapsulated to form fallout polygons. Receptor pollutant concentrations, generated by CDM2, serve as polygon fallout estimates. Fig. 2 provides a diagram of the fallout polygons generated for each industry. After generation, an attribute file was created for each polygon containing information on its toxic substance concentration, facility name, and WAT value.
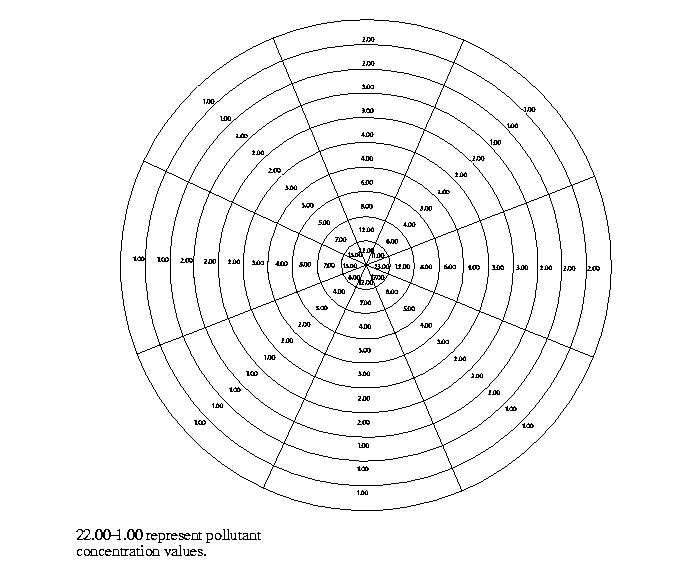
Fig. 2. Receptor generation for each industry.
Next, fallout from all facilities were aggregated to model the concentration results generated from the multiple point sources (figure 3). Items were added to the newly aggregated coverages for total concentration and total WAT. Additive concentration and WAT were then calculated for each new polygon.
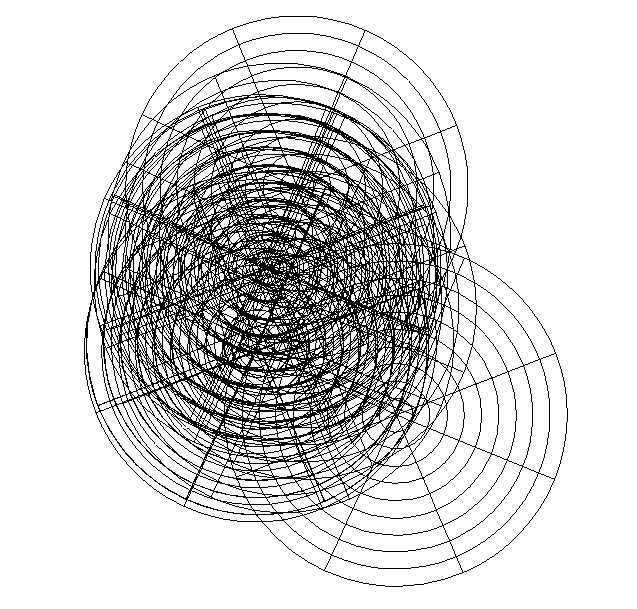
Fig. 3. Unioned industrial receptor coverages.
Choices made in displaying data are essential to research. Findings can be illustrated in a manner that conveys the wrong information or is difficult to assess. Devising an appropriate classification scheme was an important component of this study. Although the modeling of pollution fallout was based upon a weekly release amount, data were classified so that the output maps reflected the EPA�s National Ambient Air Quality Standards (NAAQS) for particulate matter (PM-10). They provide limits for annual (50 mg/m3) as well as daily (150 mg/m3) minimum allowable concentrations (EPA 1998c). Particulate matter standards were utilized because they refer to any mixture of solid or liquid chemicals found in the air. The chemicals released from the facilities under study are numerous and varied in composition and thus best suited to the PM-10 regulations.
Using these regulations as a reference, an arithmetic scale was devised to classify concentration amounts into five categories. The lowest class has an interval distance of 50, to coincide with the annual PM-10 regulations of 50 mg/m3. This resulted in class limits of 0 mg/m3 and 50 mg/m3. This interval became the basis on which subsequent classes were formed. For example, the next class has an interval twice the distance of the first, resulting in a width of 100 and boundaries of 51mg/m� and 150 mg/m3. The third doubled the distance of the second class, so that it had an interval of 200 and class boundaries of 151 mg/m3 and 350 mg/m3. This doubling and adding method was continued until all classes were established. The final class extends to the highest recorded concentration value.
Results
Concentration results cannot be considered precise. They represent the mathematical modeling of a natural phenomenon whose physics remain largely impenetrable (Venkatram 1988). While dispersion software are representative of natural processes, results are idealized. Further, it is impossible to delimit strict boundaries where concentration results vary by a small amount. Results therefore should be acceptable for broader trend based analysis but skepticism is required of the exact boundaries between fallout zones.
Concentration
Fourteen industries were utilized to produce air pollution concentrations in East St. Louis. CDM2 calculates point source dispersion from a single stack per facility. Most industries utilized numerous stacks with varying dimensions and exit temperatures. To estimate comprehensive release for each industry, nine processing runs of CDM2 were conducted, using 3 sets of stack dimensions (largest, average, smallest) in conjunction with 3 exit temperatures (highest, average, lowest) to produce 9 maps of accumulative concentration. As stated previously, accumulative concentration is dependent upon numerous factors: meteorology, stack height, stack width, exit temperature, and release amount. Differences in industrial characteristics alter the number of contributing industries to processing runs (table 1). For example, when stack dimensions and exit temperatures are high, dispersion conditions
Table 1. Processing information used to produce accumulative concentration
________________________________________________________________
# of industries Stack dimensions Exit temperature
________________________________________________________________
3 Largest Highest
3 Largest Average
9 Largest Lowest
5 Average Highest
7 Average Average
13 Average Lowest
11 Smallest Highest
12 Smallest Average
14 Smallest Lowest
________________________________________________________________
become less favorable for industries to be included in the model (fig. 4). Conversely, when stack dimensions and exit temperatures are low, more industries contribute (fig. 6). As conditions move from least to most favorable, three important trends emerge. First, the effects of wind direction become evident. Plumes start to form that mirror dominant wind patterns from the west and south (fig. 5). Second, the effects of core industries, in terms of location and release amount, are evident. The position of plumes is centered on a cluster of industries with large release amounts. Third, as concentration accumulates, new plumes form on top of previous plumes (fig. 6). These new plumes illustrate an increased concentration level for underlying areas.
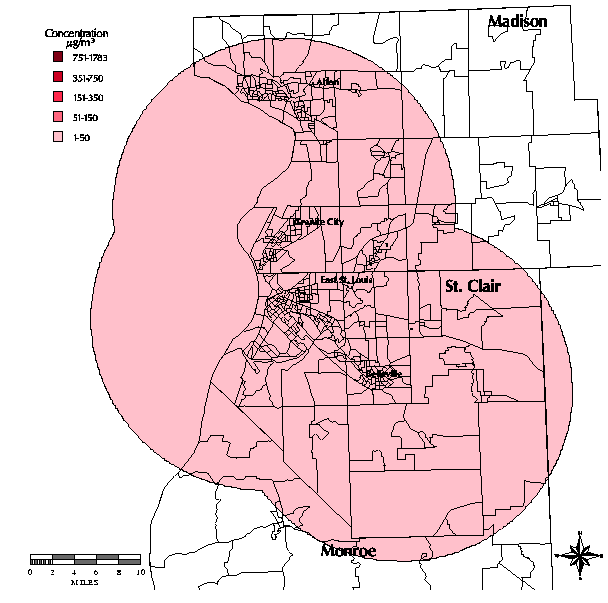
Fig. 4. Concentration produced from largest stack dimensions and highest exit temperatures.
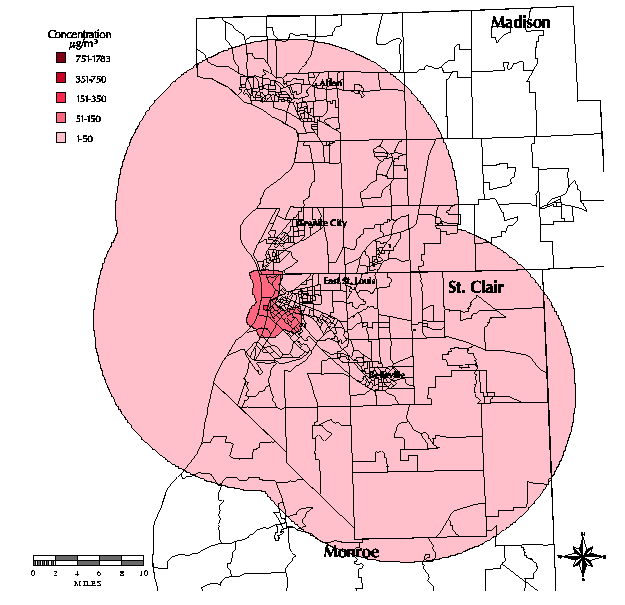
Fig. 5. Concentration produced from largest stack dimensions and lowest exit temperatures.
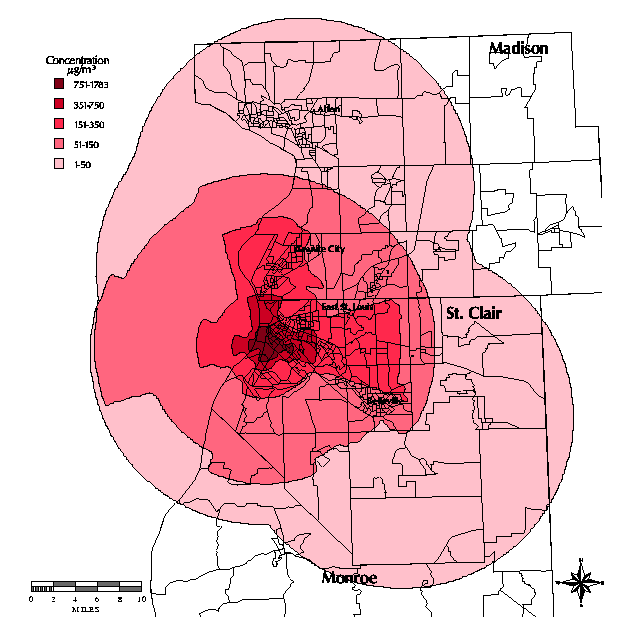
Fig. 6. Concentration produced from smallest stack dimensions and lowest exit temperatures.
Toxicity
Toxicity levels were uniformly set across all fallout polygons for each industry. The accumulation of toxicity from all pollutant sources produced a series of overlapping ovals (fig. 7). Simple linear addition through overlay combinations provided the toxicity measures. The highest toxicity zone encompasses Granite City and extends to East St. Louis. Several industries with high WAT values release pollutants to this area.
The generation of accumulative toxicity rings is straightforward, but the results are problematic. Accumulative toxicity assumes that the constitution of a release remains the same during the entire dispersal process. In reality, some chemicals may have different rates of fallout. Additionally, the fate of many chemicals in environmental media is not well known.
Zone of Greatest Potential Risk
Pollution concentration and toxicity should both be considered when assessing risk. The highest levels of these pollution components in conjunction should pose the greatest risk for health. Highest potential toxicity (WAT 29-32) was overlaid with highest concentration (zones 1-3) to create a zone of greatest potential risk (fig. 8). Concentration zones 1-3 were utilized to encompass all concentrations above the NAAQS one-day limit for particulate matter (151 mg/m3).
For the study area of Madison, Monroe, and St. Clair counties, East St. Louis disproportionately receives the greatest amount of pollution. In contrast to the study area overall, citizens within this municipality are predominantly non-Caucasian, poor, lacking in college education, and contain other societal inequities such as inferior housing. These individuals and Granite City residents also have a disproportionately greater potential for health problems attributed to air pollution than do other communities in Madison, Monroe, and St. Clair counties.
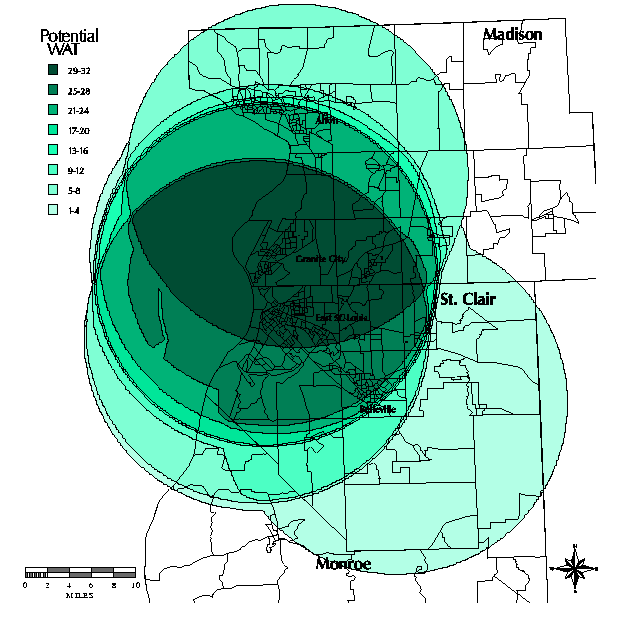
Fig. 7. Accumulative toxicity.
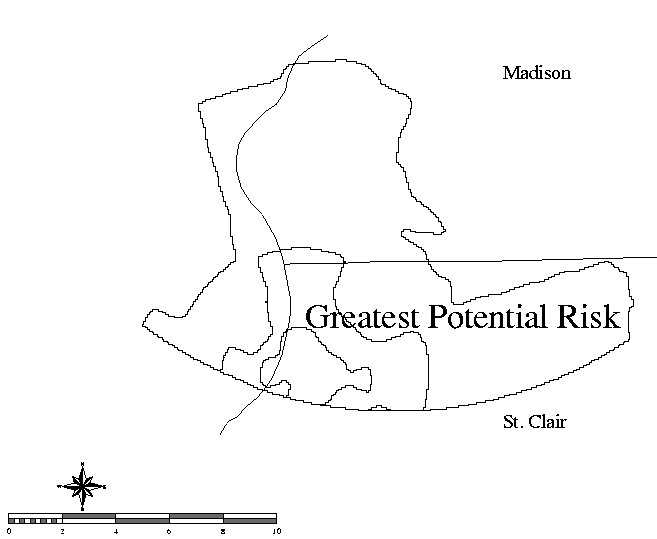
Fig. 8. Overlay of highest accumulative concentration and highest accumulative toxicity to create a zone of greatest potential risk.
Conclusions
Although this investigation has provided a means for establishing air pollution trends in East St. Louis from multiple sources, it has some deficiencies that need further research. The first three relate to the integration of dispersion models with GIS, while the last is applicable to GIS risk assessments in general.
First, more consideration is needed for industries having multiple stacks and fugitive sources. Increased accuracy could occur if individual stack outputs and non-point sources were addressed. The framework of this current research could support such applications. With additional information, it would be possible to model all releases and aggregate these to represent a single industrial output.
Second, exploration should continue with the use of other dispersion modeling software. Alternative formats could provide more precise dispersion estimates. As a result, advancements in the integration of GIS and modeling programs may be possible which would lead to more refined or standardized procedures. Modeling programs that produce variance in risk estimates should be thoroughly evaluated for data requirements, processing methods, and data entry. Broader issues of model applicability, accuracy, and appropriateness are also relevant.
Third, more work is needed on the variables utilized in modeling. Identification of what pollutants leave which stacks at what times would provide a more comprehensive and realistic view of risk. Chemicals released in smaller amounts at varying times will provide a different view of concentration than if the release is considered of all chemicals at once.
Additionally, more research is needed into modeling the environmental interaction of chemicals. Given that many of these interactions are not yet known, this would be a difficult process. A better estimate of toxicity could be acquired through research of GIS interaction techniques for modeling chemical combinatory processes.
The most pressing need for GIS risk assessment is the correlation of findings from a recognized health study. Dunn and Kingham (1996) believe that the use of GIS and modeling software can enhance epidemiologic enquiry into air pollution. They call for well-funded, multidisciplinary and holistic approaches, to investigate relationships between environmental, specifically atmospheric, factors and human health status.
While acknowledging limitations, this research has potential in the realm of risk communication within a community setting, enabling and empowering citizens by providing knowledge about the proximity of possible respiratory health hazards. It may also prove beneficial to policy makers by providing information concerning environmental quality and equity, important components to many issues such as zoning, redevelopment, and health care accessibility.
References
Dunn, Christine, and Simon Kingham. 1996. Establishing links between air quality and
health: Searching for the impossible? Social Science and Medicine 42:831-41.
EPA. February 10, 1997a. Environmental Justice at U.S. EPA Region 5: An Agenda for
Action (Gateway). http://www.epa.gov/envjustice/agenda.html#Gateway
_______. February 10, 1997b. Support Center for Regulatory Air Models (SCRAM)
_______. August 1, 1998e. 1995 National Air Quality Trends Brochure � Particulate
Matter. http://www.epa.gov/oar/aqtrnd95/pm10.html
Irwin, John S., Thomas Chico, and Joseph Catalano. 1985. CDM 2.0 Climatological
Dispersion Model User�s Guide (Abriged). Research Triangle Park, N.C.: Atmospheric
Sciences Research Laboratory, Office of Research and Development.
U.S. Environmental Protection Agency.
NIOSH Pocket Guide to Chemical Hazards. 1994. U.S. Department of Health and Human
Services. Washington, D.C.: U.S. Government Printing Office.
Schierow, Linda-Jo. July 10, 1998. Environmental equity. Congressional Research
Service Report for Congress, August 14, 1992.
http://www.cnie.org/nle/gen3.html
Scott, Michael S, and Susan L. Cutter. 1997. Using relative risk indicators to disclose
toxic hazard information to communities. Cartography and Geographic
Information Systems 24:158-171.
Venkatram, Akula. 1988. Dispersion in the stable boundary layer. In Lectures on Air
Pollution Modeling, edited by Akula Venkatram and John C. Wyngaard. Boston,
Ma.: American Meterological Society. 229-263.
Zannetti, Paolo. 1990. Air Pollution Modeling. New York: Van Norstrand Reinhold.
Author Information:
Brian Welde
Project Manager
Spatial Data Research
P.O. Box 1311
Columbia, Mo. 65205
573-592-7430
573-592-0951 FAX
bwelde@sdrmaps.com