Flood Plain Determination using ArcView and HEC-RAS
Richard A. Kraus, P.E.
Dodson & Associates, Inc.
Abstract
Introduction
The Study
The Analysis
Hydraulic analysis
Creating the terrain TIN
Creating 2-D lines
HEC-RAS GIS Import File Creation (Pre-Processing)
Input Data Manipulation
HEC-RAS Modeling
HEC-RAS Output
Flood Plain Mapping (Post-Processing)
Results and Conclusions
Acknowledgements
References
Author Information
AbstractArcView with 3-D Analyst and a new extension (GIS StreamPro) were used to extract data from a Triangulated Irregular Network (TIN) that represents a watershed being restudied for the National Flood Insurance Program (NFIP). The data consisted of flood plain cross sections and reach lengths, which were located to coincide with field surveyed cross sections of the channels being restudied. The flood plain data developed in ArcView was imported into HEC-RAS where it was combined with the field surveyed channel data in order to construct full flood plain cross sections that reflected accurate channel and overbank data for the HEC-RAS model. The HEC-RAS program computed water surface elevations along the channels being studied in this watershed and the results were transferred back to ArcView where the flood plain limits were automatically and accurately mapped.
This paper describes a case study where ArcView with 3-D Analyst plus a new extension (GIS StreamPro) were used to facilitate the hydraulic modeling of a channel with several tributaries and the plotting the resultant flood plain. The hydraulic model used the HEC-RAS (River Analysis System) program developed by the Hydraulic Engineering Center of the U. S. Army Corps of Engineers.
GIS StreamPro is an ArcView extension developed primarily at Esri under the name AVRAS. Dodson & Associates, Inc. will be distributing GIS StreamPro and providing technical support, training, a comprehensive users manual, and periodic upgrades. GIS StreamPro interprets cross section data and reach lengths from a terrain TIN (triangulated irregular network), then creates a file with that data that can be read into the HEC-RAS program. The data creates the basic geometry file of a hydraulic model. Bridges, culverts, other physical characteristics of the channels and overbanks that can not be extracted from the TIN are manually entered in the HEC-RAS program along with discharges, starting water surface conditions, and other coefficients (‘n’ values, expansion and contraction coefficients, etc.). After the HEC-RAS model is completed and the results are acceptable, a GIS export file is created by the HEC-RAS program, which contains centerline and cross section alignments, water surface elevations at the cross sections, and a bounding polygon defining the maximum extent of the flood plain. GIS StreamPro reads the GIS export file and creates a water surface TIN from the bounding polygon, cross section alignments, and water surface elevations, then compares the water surface TIN to the terrain TIN and produces a flood plain polygon.
The watershed analyzed is Mill Creek located in Lufkin, Texas. The study consisted of identifying existing flood hazards, and developing both short-term and long-range plans for mitigating those flood hazards. The City of Lufkin and the Texas Water Development Board jointly funded the study. This paper covers the identification of the existing flood hazards.
A total of thirteen (13) roads and railroads cross the channels of Mill Creek and it’s various branches and forks. The existing channels are for the most part unimproved. The channel side slopes are steep in many areas, and there is evidence of erosion in some reaches. The banks and bottom of the channel are vegetated with brush and small trees in many areas.
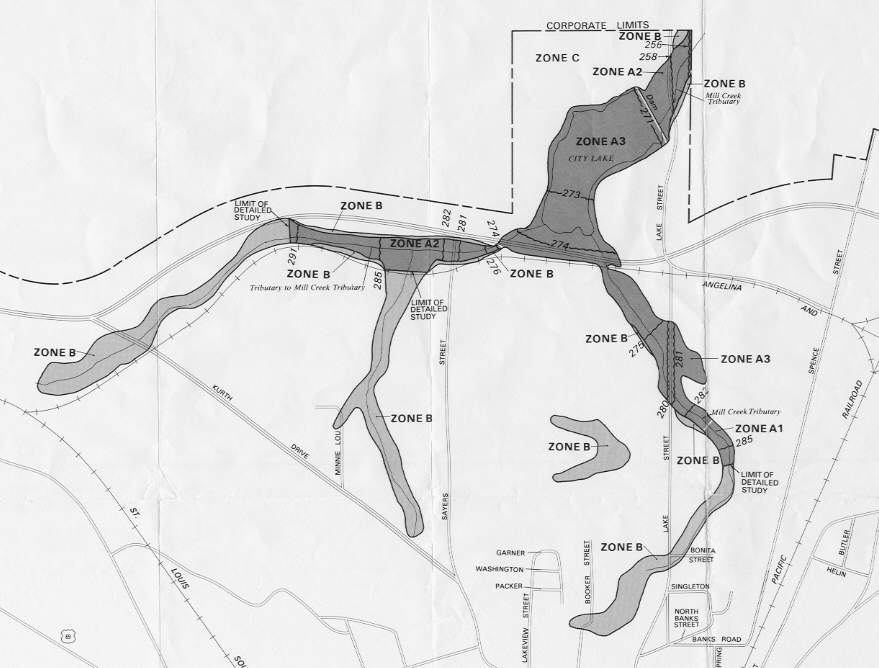
The City of Lufkin is a participant in the National Flood Insurance Program. The Flood Insurance Study (FIS) 100-year flood plain was published in 1982 from a detailed study. It extended about 4,000 feet upstream from Ellen Trout Lake on both East and West Branches. This existing conditions study extended the FIS limits approximately 3,000 feet on both branches, plus added studies of two more tributaries. Illustrated in the figure below is the existing Flood Insurance Rate Map for the portion of Mill Creek being studied.
Figure 1. Effective Flood Insurance Rate Map, Mill Creek City of Lufkin, Texas, 1982.
The study began with the collection of data, which included previous studies, field reconnaissance, aerial photographs, topographic maps, etc. Field survey needs were identified that included benchmark identifications, and channel cross-sections. The channel cross sections were drawn on a ‘working’ topographic maps that were used in the field by the surveyors.
The hydrologic analyses of the Mill Creek watershed used the HEC-1 computer program developed by the Hydrologic Engineering Center of the U.S. Army Corps of Engineers. The watershed was divided into fifteen (15) sub-areas and peak flow rates were computed based on standard design storms, Clark unit hydrograph methods, and modified Puls routing routines.
A comparison of peak flow rates from FIS with the results of the existing condition study found consistent results. The following table lists the drainage area sizes and 100-year peak flow rates.
|
COMPARISON OF 100-YEAR FLOW RATES FROM FIS AND EXISTING CONDITION STUDY |
||||
|
Location |
Flood Insurance Study |
Existing Condition Study |
||
|
Drainage Area (sq. mi.) |
100-Year Peak Flow (cfs) |
Drainage Area (sq. mi.) |
100-Year Peak Flow (cfs) |
|
|
Mill Creek at Corporate Limits |
3.4 |
2830 |
3.42 |
2878 |
|
East Branch at Ellen Trout Lake |
1.0 |
1380 |
1.10 |
1102 |
|
West Branch at Ellen Trout Lake |
1.9 |
1890 |
1.64 |
1700 |
The HEC-RAS computer program developed at the U.S. Army Corps of Engineers Hydrologic Engineering Center was used for all hydraulic analyses of Mill Creek and its tributaries. The HEC-RAS program uses Manning’s Equation to compute water surface profiles given cross-section data, roughness coefficients, and flow rates. In addition, the program has a number of special capabilities related to the analysis of culverts and bridges at roadway crossings.
The HEC-RAS data used for all analyses is based on field survey data provided by Everett Griffith Jr. & Associates, Inc. (EGA) and supplemented with data from aerial topographic maps developed by United Aerial Mapping, Inc. Field-surveyed cross-sections obtained by EGA typically includes the channel plus overbank data for a distance of 200 to 300 feet on either side of the channel. The cross sections were located near the various bridges and culverts and at select intervals along the channels.
The terrain TIN was developed from a combination of field survey data and topographic map data. The survey data was collected on total station survey instruments, which generated a tabular listing of the x, y, and z coordinates for every point. The topographic maps consisted of 2-foot contours that were supplied in digital format as 3-D lines readable in AutoCAD. A table of x, y, and z coordinates was generated from the topographic contours that were consistent with the field survey data in terms of the horizontal coordinate system and the vertical datum. The survey data point listing was then added to the table of points from the topographic maps. In ArcView an event theme was created from the point table. The terrain TIN was created from a command in 3-D Analyst.
The next step in pre-processing a HEC-RAS geometry file is locating various polylines over the terrain TIN where data will be extracted and measurements taken. These lines are 2-dimensional lines representing the channel centerline, high bank locations, flow path lines, and cross-section locations. Each line or set of lines is a separate polyline type shape file theme created for this study.
After the study limits were set along the various tributaries, the centerline theme was created and the centerlines for each channel were drawn from upstream to downstream. The tributary centerlines were also drawn with the downstream ends snapped to the centerline of the receiving channel and the receiving channel centerlines were segmented into upstream and downstream reaches. The attribute table of the centerline theme was edited by creating columns that identified the ‘river’ and ‘reach’ names (HEC-RAS terminology) for each channel segment. Another column was added that identified each segment as being either an intermediate segment or the furthest downstream segment of a ‘river’. The centerline theme is used to determine stationing along the channel and the connectivity of the various reaches.
The high bank lines were drawn according to the terrain TIN for each channel segment. The bank lines are used to determine the location of the left and right bank locations on the cross sections.
The flow paths theme consists of three polylines for every channel segment. The lines represent the left overbank flow, main channel flow, and the right overbank flow. The center flow path was created by copying the centerline polyline. The left and right overbank flow paths were drawn from upstream to downstream at the assumed location of the centriod of overbank flow, namely 1/3 the width of the flood plain measured from the channel banks. The attribute table of the flow paths was edited to identify the flow paths as being left, right, or main channel flow paths.
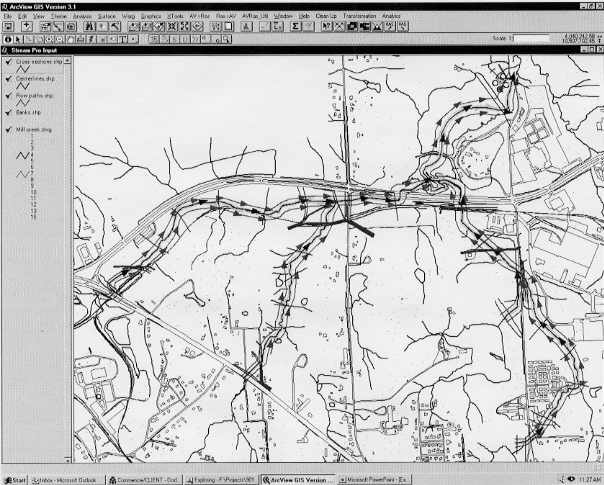
The cross section theme was created and the cross section alignments were all drawn left to right looking downstream. The location of the cross sections were drawn approximately where the field survey data for the channels were taken (more about this under Input Data Manipulation) and extended into the overbanks a sufficient distance encompass the flood plain. Each cross section traversed one set of flow paths, high bank lines, and one centerline. Also, the cross sections were not allowed to cross other cross sections. The following figure shows the stream layout with the 2-D line themes and the direction in which they were drawn.
Figure 2. Polyline themes drawn over the base map
HEC-RAS GIS Import File Creation (Pre-Processing)
After the 2-D lines are drawn and the attribute tables for the centerline and flow path themes are edited, a number of steps are performed that create the data file used by the HEC-RAS program. These steps are listed as separate tasks under the AV>RAS menu.
The first step identifies the various 2-D themes used by the program. The Theme Set-up dialog box includes entry windows to identify the terrain TIN, 2-D centerline theme, banks theme, flow paths theme, 2-D cross section theme, and the HEC-RAS GIS Import file name. The HEC-RAS GIS Import file name must use an extension of ‘.geo’.
After identifying the various themes and file names, the 3-D channel centerline is created. This is accomplished by first computing the lengths and stationing along the channel centerlines. The command is located under the utility menu because these values can be manually entered if the start and end stations are already known. The centerline topology is then determined, which assigns From-node and To-node attributes for reach connectivity. Finally, the 2-D centerline is draped across the terrain TIN and a new theme is created, 3-D centerline, which consists of the alignment of the 2-D centerline but with points located everywhere the centerline alignment crosses an angle in the TIN.
The 3-D cross section theme is next created. The initial steps involved in this process include assigning the ‘river’ and ‘reach’ names to each cross section, determining the cross section stationing, measuring the locations of the left and right banks stations along each cross section, and finally computing the flow lengths between each cross section. The last step correlates the alignment of the cross sections with the terrain TIN by extracting the elevations from the terrain TIN and creating a 3-D cross section theme.
The final pre-processing tasks create the HEC-RAS GIS import file. The import file contains three parts, the header, the centerline coordinate listing, and the cross section data. These three parts can be performed separately, under the pull down menu, or automatically by selecting a single tool bar button. The HEC-RAS GIS import file is an ASCII text file.
In this study, the cross section data points collected from the field survey efforts were added to the data point listing of the topographic contours before the terrain TIN was created. This allowed the cross section alignments to be drawn close to the field survey points. However, it is important in hydraulic modeling that the actual field survey points be reflected in the cross section data points so that verification of actual field measured elevations can be made. To do this, HEC-RAS GIS import file was edited in a text editor by selectively replacing the points taken from the terrain TIN at the channel with actual surveyed points. The result was cross section point listings that contained data from the terrain TIN for the overbanks and data from the field survey for the channel. The reach lengths, and stationing remained unchanged, but the bank locations had to be manually adjusted.
Note, there are other ways of achieving the same results. The cross section lines can be snapped to the survey points in AutoCAD and copied to the 2-D cross section theme. With this procedure, manipulation of HEC-RAS GIS import file would be eliminated.
The HEC-RAS GIS import file is read into the geometry data editor. The view displays the centerline, and cross sections with the proper alignment and orientation. The ‘river’ and ‘reach’ names appear, along with the cross section stations, and flow direction arrows.
After the cross sections were created, thirteen (13) roadway structures (culverts and bridges) that exist along Mill Creek and its various branches were inserted into the HEC-RAS models. The Manning roughness coefficients for channels and flood plains were also inserted into the models to complete the geometry models of Mill Creek and its tributaries. Flow rates from the hydrologic analysis were used in the steady flow files, and normal depth starting conditions were selected, which required the input of the average channel slope. In this study of Mill Creek and its tributaries, there are seven reaches and three junctions. The GIS import file automatically establishes the connectivity of these reaches to the various junctions. As a result, the downstream and upstream starting hydraulic conditions for the different reaches are automatically setup in the steady flow editor.
The following table provides a comparison of the effective FIS and existing condition 100-year flood levels for Mill Creek and its tributaries. As indicated in the table, existing condition flood levels are similar to or somewhat greater than FIS values at most locations. However, a few updated flood levels are lower than FIS values.
|
COMPARISON OF 100-YEAR FLOOD LEVELS FROM FIS AND EXISTING CONDITION STUDY |
||
|
Location |
FIS (feet) |
Existing Condition (feet) |
|
Mill Creek (Called "Mill Creek Tributary" in FIS) |
||
|
Upstream of Lake Street |
258.4 |
258.31 |
|
Upstream of Ellen Trout Lake Spillway |
270.8 |
270.91 |
|
Upstream of Loop 287 |
273.8 |
274.28 |
|
Mill Creek East Branch (Called "Mill Creek Tributary" in FIS) |
||
|
Upstream of Railroad |
274.3 |
274.90 |
|
Upstream of Lake Street |
281.0 |
280.68 |
|
Mill Creek West Branch (Called "Tributary to Mill Creek Tributary" in FIS) |
||
|
Upstream of Loop 287 |
273.8 |
274.27 |
|
Upstream of Sayers Street |
281.6 |
278.94 |
After a satisfactory HEC-RAS model was created, and the output deemed acceptable, the GIS export function in HEC-RAS is applied. The commands are located under the main window file menu. The options available include naming the export file, selecting the profiles to be exported, whether or not to include interpolated cross sections, and a selection of the entire cross section or just the channel.
The actual export file is an ASCII text file containing a header that includes filenames, number of profiles, reaches, cross sections, etc. The next section of the output file is the stream network coordinate listing, which includes the coordinates of the nodes for each reach (upstream and downstream end points), and the 2-D cut line for each reach. The cross sections follow the centerline information and contain identification data, water surface elevations, and cut lines. The last part of the output file is the coordinates of the bounding polygon. This polygon defined the maximum possible extent of the flood plain and is defined according to the limits of the cross sections. The coordinates of the polygon correspond to the end points of the cross sections. For floodway profiles, the bounding polygon would correspond to the encroachment stations that define the floodway limits.
Flood Plain Mapping (Post-Processing)
With the HEC-RAS GIS export file created the post-processing aspects of GIS StreamPro were used to map the flood plain over the terrain TIN. In ArcView under the RAS>AV menu, the first command is a Them Setup dialog box. In it are specified the HEC-RAS GIS export file, the terrain TIN, the output directory name where the flood plain themes are stored, and a rasterization cell size. The rasterization cell size corresponds to the map units and defines the resolution of the flood plain boundaries.
The post-processing is performed in three separate steps, or automatically through a tool bar button. The steps involved in the post-processing start with the generation of the bounding polygon and cross section alignments. These are read directly from the HEC-RAS GIS export file and new themes are created for each. A water surface TIN is created next with the extent defined by the bounding polygon. The water surface elevations at each cross section are applied along the cross section alignments and the TIN is created by treating the cross sections as breaklines in the elevations.
The final step meshed the water surface TIN with the terrain TIN to produce the flood plain. This command converts the water surface TIN and the terrain TIN into grids according to the rasterization cell size specified in the Theme Setup dialog box. The two grids are then compared cell-by-cell and the cells where the water surface elevations are greater than the terrain elevations are considered to be within the flood plain. After the comparison is complete, the cells considered to be within the flood plain are converted into a polygon shape file.
The resulting existing condition flood plain polygon was then placed over the existing Flood Insurance Rate Map (FIRM) in order to compare the results. The FIRM was scanned and brought into ArcView as an image, then converted to a grid. By using the warp commands, the FIRM ‘grid’ was manipulated to correspond to the coordinates of the flood plain polygon. The following figure illustrates the comparison.
Figure 3. Comparison of Existing Condition 100-Year Flood Plain to Effective FIRM
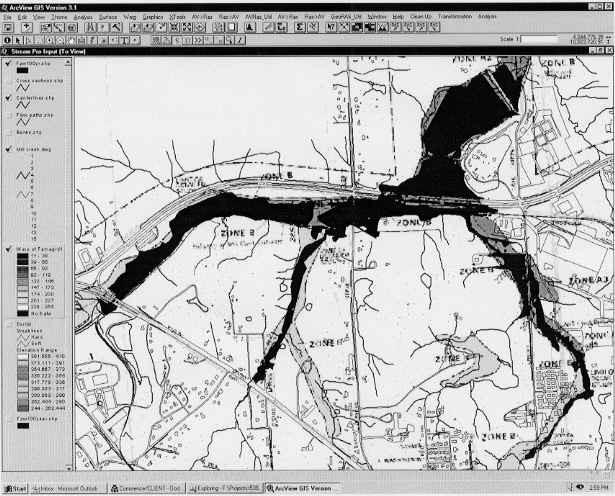
The comparison shows differences between the two flood plain plots. Some reaches have wider flood plains, while other areas show distinct reductions in flood plain widths.
The application of GIS StreamPro in an actual study resulted in increases in efficiency and accuracy. The efficiency was found in a reduction in time required to manually code the cross section points into the HEC-RAS model and the elimination of human errors due to typographical mistakes. Additionally, during the fully developed conditions and interim flood control conditions included in the study, a reduction in time and effort were since the terrain TIN had already been created during the existing condition analysis.
The increased accuracy benefit was found in not only an elimination of human errors during the input of data, but also during the flood plain plotting. Prior to GIS StreamPro, flood plain plots between cross sections was subject to interpretation of the contours. With GIS StreamPro, the flood plain is plotted continuously according to the terrain TIN and no interpretation between cross sections is needed.
The program development and contributions from the Hydrologic Engineering Center and Esri which led to GIS StreamPro is greatly appreciated. Without the foresight and commitment of the HEC to create new and better ways of utilizing data sources in the field of water resources, GIS StreamPro would not be possible.
Barrett, Duane
, Dodson & Associates, Inc., Identification of Existing Flood Hazards and Development of Interim and Future Drainage Improvement Plans for The Mill Creek Watershed, City of Lufkin, December 30, 1998.Field Survey Data for Mill Creek and Tributaries, Everett Griffith Jr. & Associates, Inc.
Aerial Topographic Maps, United Aerial Mapping, Inc.
Flood Insurance Study for the City of Lufkin, Texas, Federal Emergency Management Agency, 1982.
Brunner, Gary W., HEC-RAS User’s Manual, April 1997.
Djokic, Dean, AVRAS Extension, Esri, 1998.
Richard A. Kraus, P.E.
Dodson & Associates, Inc.
5629 FM 1960 West, Suite 314
Houston, TX 77069-4216
Telephone: 281-440-3787
Fax: 281-440-4742
www.dodson-hydro.com dkraus@dodson-hydro.com