The Accuracy and Efficiency of GIS-Based Floodplain Determinations
by
Roy D. Dodson and Xiaojian Li
Dodson & Associates, Inc.
5629 FM 1960 West, Suite 314
Houston, TX 77069-4216
1-800-235-8069 (US or Canada)
281-440-3787
fax 281-440-4742
www.dodson-hydro.com software@dodson-hydro.comAbstract
New software and hardware platforms, along with new data collection technologies, are making it feasible to prepare Digital Terrain Models (DTMs), stored as Triangulated Irregular Networks (TINs) for many areas. These TINs can serve as the basis for computing floodplain elevations and mapping floodplain boundaries, using new automated floodplain mapping software that is now becoming available.
This paper explores the differences between a floodplain study performed using automated floodplain mapping software and the same study performed using currently-accepted methods. Two questions are answered in this paper:
To address the issue of efficiency, an actual stream channel was studied using traditional methods. The same stream channel was also studied using automated floodplain mapping software. A careful record was maintained of the tasks performed and the time required for each task. The results indicated that automated floodplain mapping software provided significant improvements in efficiency for many of the tasks involved in floodplain computations and mapping. Even more dramatic improvements should be expected when revisions or corrections are required to existing data.
To address the issue of accuracy, the results of the traditional analysis were compared with the results of the automated method. Several differences in the results were noted, but this does not indicate which, if either, of the two methods was more accurate. In order to answer this question, an analysis of each method was performed, isolating and analyzing individual sources of error. The conclusion of this analysis is that the elimination of almost all manual data entry through the use of automated floodplain mapping software should result in significantly fewer human errors in the hydraulic analysis and floodplain mapping procedures. Therefore, the floodplain profiles and floodplain boundaries produced using the automated procedures should be more accurate under most normal conditions, provided that the TIN model available for use in the automated computations is derived from the same topographic data source used for the manual data entry.
In 1995, the U.S. Army Corps of Engineers Hydrologic Engineering Center (HEC) released the first version of the HEC-RAS (River Analysis System). HEC-RAS is a "next generation" program, implemented under the Microsoft Windows operating system, and using modern graphical user interface conventions. HEC-RAS is the successor to the HEC-2 computer program, which was the most widely used method of computing water surface profiles, floodplain boundaries, and other related information for stream channels.
HEC-RAS offers many new features and conveniences, but one of the most interesting is a GIS data interface. Through this interface, HEC-RAS can receive input data from an external program (such as a GIS). The input data that may be received in this way includes the following:
These data values represent a huge proportion of the total amount of input data required for a hydraulic analysis. For stream systems without bridges or other special conditions, only the Manning roughness coefficients, the expansion and contraction loss coefficients, the discharge rates, and the hydraulic boundary conditions would be required in order to compute a complete water surface profile. If road crossings are present, they must be added using the powerful and user-friendly data entry capabilities of HEC-RAS.
After the hydraulic analysis has been performed by HEC-RAS, and the computed water surface profiles for the stream system are available, HEC-RAS can export these results back to the external program (GIS).
Capabilities of GIS Stream Pro
GIS Stream Pro is a software program distributed by Dodson & Associates, Inc. and designed to provide an interface between HEC-RAS and ArcView (with the ArcView 3D Analyst). GIS Stream Pro fully supports all of the features of the HEC-RAS GIS interface introduced above, including the following:
With the high degree of automation achieved by GIS StreamPro, it would appear logical to assume that a floodplain study might be performed very efficiently using this new method. However, GIS StreamPro requires that a Triangulated Irregular Network (TIN) be available for all of the floodplain areas to be considered in the analysis. The time and effort required to obtain such a TIN, or to assemble one from available data sources, could outweigh the efficiencies of the other processes.
In order to determine if GIS StreamPro provides increased efficiency, a typical floodplain analysis was performed using GIS StreamPro and using traditional methods. A careful record was kept of the work items and staff time required for each method.
It should be noted that there are various kinds of floodplain analyses, and these may vary considerably in term of goals, extent of details desired, and types of topographic data used. In addition, of course, the types and characteristics of stream channels and floodplains also vary considerably from place to place. The floodplain analysis considered in this paper is one of the most common and simple: perform hydraulic modeling using HEC-RAS and produce a floodplain map for a previously unstudied natural stream. The location is a small city in east Texas, considered to be topographically similar to many areas across the United States.
For this analysis, efficiency is defined as the ability to produce a desired result with a minimum of effort, expense or waste. In the case of a floodplain analysis conducted by engineers, the efficiency primarily focuses on minimizing the expense in acquiring data and the time required for completing the analysis. A complete analysis of efficiency should consider not only the effort and time required to perform a task once, but also the likelihood that some or all tasks may need to be performed more than once. In the process of completing a floodplain analysis, for example, it is often necessary to repeat parts of the process with some revised input to achieve the desired results, such as inserting additional cross sections.
For this analysis, accuracy is defined in two terms: 1) the ability to produce a known or standard result; and 2) the ability to reproduce a previous result. Ideally, a comparison of accuracy should involve using each of the two methods to produce a known or standard result. However, this is quite difficult to do in the case of a computed water surface profile and floodplain boundary, for the following reasons:
We were unable to locate a stream channel for which these data were available for a historical storm event. Therefore, we were unable to perform a direct comparison of accuracy. Instead, we have performed an analysis of the potential sources of error within each of the two methods.
Floodplain Analysis Work Items
A floodplain analysis involves three primary categories of work items:
The following sections describe each of these categories and compare the work required using traditional methods and using GIS StreamPro.
Data Collection and Preparation
A floodplain analysis requires three different types of information:
This analysis is concerned only with the collection and preparation of topographic data. The traditional sources of topographic data have been:
Most floodplain studies involve at least some field survey work. Experience has proven that it is difficult to obtain accurate results without at least obtaining field survey data for the channel portion of each cross-section. Often, to save money and time, the remainder of each cross-section is obtained from aerial spot elevations and/or contour maps.
New technologies developed over the past several years now offer new alternative sources of topographic data, including the following:
The recent emergency of new data collection technologies such as LIDAR (light-imaging radar) is making the use of TIN models much more cost-effective. LIDAR typically provides very dense topographic data (coordinates are often available no more than 10 ft apart). These coordinates can be assembled into a very accurate TIN in many cases, although the size of the resulting data file can be a problem.
In addition to the cross-section data, the importance of the reach lengths between each adjacent cross-section must not be overlooked. Channel reach lengths are usually measured from CAD drawings. Measurement of overbank reach lengths, however, requires engineering judgment in deciding the paths of overbank flows. This process is most often performed manually by drawing the overbank flow paths on base map and measuring the reach lengths by hand or in CAD program after digitizing the flow paths.
The biggest work item involved in using GIS StreamPro for data collection and processing is the creation of the TIN. However, ArcView 3D Analyst makes this a relatively simple procedure.
Once the TIN is created, cross sections, flow paths, centerline and bank lines are required to be drawn in GIS StreamPro. Though this process can be tedious, the flexibility of GIS StreamPro allows the user to use existing survey lines and points (from a project layout drawing prepared using a CAD program, for example.). This process also enables the user to draw cross section lines precisely over surveyed points. This ensures that the cross-sections interpolated by GIS StreamPro follow the alignment of field surveyed cross-sections, if these have been included in the TIN model.
Once the all the lines are defined in GIS StreamPro, it only takes a few mouse clicks to process all the data and export the results to HEC-RAS.
After completing all the cross sections and reach lengths, other data must be completed. These data include contraction/expansion coefficients, Manning’s "n" values and ineffective flow areas. Hydraulic features, such as bridges, culverts, in-line weirs and levees must also be coded into the model. This step is essentially the same, regardless of whether the data were entered using the traditional method of manual data entry, or whether GIS Stream Pro was used to automate the data entry.
After creating the model, a run is executed and the results of the run are evaluated. Adjustments are made as necessary to produce reasonable and accurate results. The final product of this task is the water surface profile to be used in mapping the floodplain.
The goal of this procedure is to produce the desired floodplain map from the water surface profile calculated by HEC-RAS. It involves transferring the water surface profile to a base map to show the extent of floodplain along the studied stream. This floodplain map is useful for regulation, planning and management of storm water related issues.
Floodplain mapping by the conventional method normally requires mapping the floodplain manually, which can be a very tedious process. It is done by transferring the water surface profiles to the study base map (usually a contour map) manually. Water surface elevations are mapped at the cross sections and interpolated between cross sections. The mapping is achieved with engineering judgment to follow contours between cross sections on the base map. Hand-drawn floodplain boundaries are digitized to a CAD program and plotted out as the desired floodplain map.
Instead of manually mapping the floodplain boundaries, HEC-RAS can export the computed water surface profile in a file format that is directly readable by GIS StreamPro. GIS StreamPro processes the water surface profile with the original TIN of the ground surface to obtain the floodplain. The floodplain will honor all the topographic features defined by the TIN and no judgment is involved in this process.
The shape file of the floodplain created by GIS StreamPro can be imported to a CAD program (if necessary) and overlaid with the study base map. The floodplain boundaries created by GIS StreamPro may appear to be jagged. If this is the case, the size of the computation grid used for the floodplain mapping may be reduced. This is a minor adjustment in GIS StreamPro; no additional HEC-RAS analysis is required.
The most time consuming steps of the conventional method are:
The most time consuming steps when using GIS StreamPro are:
Description of Efficiency Case Study
The case study focuses on a reach of Cedar Creek Tributary #1 in Lufkin, TX. The reach of the natural stream is 4,000 feet in length. Ten (10) channel sections are field surveyed along the reach at intervals of about 500 feet. The reach includes one culvert roadway crossing. Aerial mapping was used to define the general topography of the watershed and two-foot contours were created from the aerial mapping.
In order to compare the efficiency of the conventional method with the GIS StreamPro method, two tasks were performed. Task 1 is to produce the 100-Year floodplain map for the reach using the conventional method. Task 2 is to produce the same floodplain map using GIS StreamPro. During the process of each task, time consumed for major steps were recorded for comparison of efficiency
The conventional method uses the surveyed channel section and the overbank data obtained from the contours to create the cross sections. Reach lengths are measured from base maps by hand. All the data are input to HEC-RAS manually. Floodplain mapping is first done manually on a base map. The final floodplain map is produced after digitizing the boundaries into AutoCAD.
GIS StreamPro used the same survey points obtained for the conventional method as part of the input data for the creation of a TIN. The two-foot contours created from aerial mapping are converted into three-dimensional coordinate points. These are then combined with the field surveyed points to create the TIN. The cross sections, flow paths, centerline and bank lines are drawn on the study base map using a CAD program. This CAD drawing is then exported to ArcView, where it is used by GIS StreamPro.
The following table and figure compare the results for each method:
Table 1 Results of Efficiency Case Study
|
General Procedure |
Conventional Method Steps |
Time (min.) |
GIS StreamPro Steps |
Time (min.) |
|
Data collection and preparation |
Planning field survey for channel data |
N/A |
Planning field survey for channel data |
N/A |
|
Obtain overbank data from topographic maps |
120 |
Obtain terrain data |
10 |
|
|
Organize and merge surveyed channel data with overbank data to create full cross sections. |
120 |
Merge terrain data with survey data and create TIN in GIS StreamPro |
30 |
|
|
Prepare base map and measure reach lengths |
30 |
Draw cross sections, flow paths and bank lines |
45 |
|
|
Process and export data for HEC-RAS |
5 |
|||
|
270 |
90 |
|||
|
Model set up and execution |
Input data to HEC-RAS |
75 |
Import data to HEC-RAS |
5 |
|
Complete the HEC-RAS |
30 |
Complete the HEC-RAS |
30 |
|
|
Execute model, evaluate results, and fine tune the model as necessary |
30 |
Execute model, evaluate results, and fine tune the model as necessary |
30 |
|
|
Export floodplain data for GIS StreamPro |
5 |
|||
|
Sub Total |
135 |
70 |
||
|
Floodplain mapping |
Map floodplain manually |
30 |
Import floodplain data to StreamPro and process to obtain floodplain |
5 |
|
Digitize floodplain to produce the final floodplain map |
30 |
Import floodplain into CAD and fine tune the floodplain |
30 |
|
|
60 |
35 |
|||
|
Total |
465 |
195 |
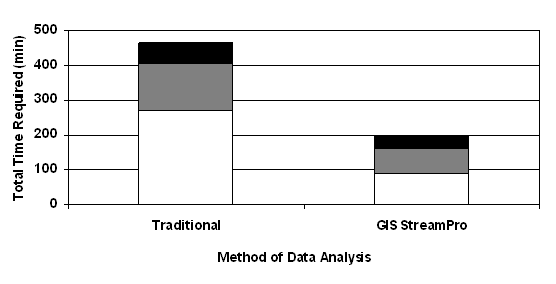
Figure 1 Comparison of Times Required for Flood Plain Analysis
Discussion of Efficiency Case Study Results
The case study shows that the GIS StreamPro is much more efficient than conventional methods in performing two general procedures of floodplain analysis. GIS StreamPro required only about 1/3 of the data collection and preparation. The obvious reason for the time efficiency is that the GIS StreamPro method eliminates the needs of much manual manipulation of data, which is reflected in three key areas: organizing and preparing cross sections, manual input of data in HEC-RAS, and floodplain mapping.
If any of the data preparation and processing steps must be redone (as is commonly the case, because of minor adjustments in some item of input data), the advantages of GIS StreamPro are even more dramatic. The existing TIN could be revised (assuming that any needed changes are relatively minor) and could then be used to quickly revise all cross-section coordinates (using the cross-section alignments and other data still available from the earlier work). This can produce significant savings if a new cross-section must be inserted between two existing cross-sections, for example.
When a conventional analysis is performed, the floodplain must be mapped only once if possible, so the floodplain mapping is typically put off until the very end of the project, so that there can be no more changes to the computed water surface elevations. If there were such a change after the floodplain had already been mapped, the entire floodplain mapping effort might have to be done again.
In comparison, GIS StreamPro can automatically compute and plot the floodplain boundaries at any step in the analysis. This means that preliminary floodplain boundaries are available for review much earlier in the study period.
In conclusion, the GIS StreamPro and HEC-RAS can increase the efficiency of performing a floodplain analysis tremendously when compared to the conventional method. With more powerful computers, better terrain data, and more data and drawings becoming available in digital format, GIS StreamPro has the potential to become even more efficient in floodplain analysis.
Accuracy of Computed Water Surface Profiles
Since water surface profile computations are used to determine floodplain elevations and boundaries, the accuracy of computed water surface profiles is a very important consideration. The Hydrologic Engineering Center of the U.S. Army Corps of Engineers published the results of a study of the accuracy of computed water surface profiles in 1986 [USACE, 1986]. The 1986 HEC study, along with later work done at the Waterways Experiment Station [Freeman, Copeland, and Cowan, 1996] provides the basis for determining the most important sources of errors in the computation of water surface profiles using a one-dimensional gradually-varied program such as HEC-RAS. The results of these studies show the following:
The automated floodplain software considered in this analysis does not provide any assistance with the selection of a manning roughness coefficient. However, it can be very useful in the preparation of adequate cross-section data.
Errors in Topographic Data for Water Surface Profiles
There is currently no source of topographic data that provides higher accuracy than traditional field survey methods, using modern equipment. When the location, orientation, and length of cross-sections are planned in advance by an experienced hydraulic engineer, and then carried out by an experienced and professional field survey crew, the resulting information is almost ideal for performing an accurate water surface profile computation.
Too often, however, budget and schedule restrictions result in a reduction in the number of cross-sections that may be obtained. This leads to excessive reach lengths, which can cause several different warnings and error messages during the computation of the water surface profile. The distance between cross-sections is too long if hydraulic properties of the flow change too radically from cross-section to cross-section. If, from one cross-section to the next, the slope of the energy grade line decreases by more than 50% or increases by more than 100%, the reach length may be too long for accurate determination of energy losses caused by boundary friction. For example, Figure 2 illustrates a HEC-RAS plot of energy slope versus channel station. Each point on the chart represents the energy slope computed at a particular cross-section along the stream channel. Note that there are three cross-section locations (including the starting cross-section) at which there are "spikes" in the computed energy grade line elevations. Inserting additional cross-sections reduces one of these "spikes" considerably, as the figure also indicates.
Figure 2 Example of Excessive Cross-Section Spacing
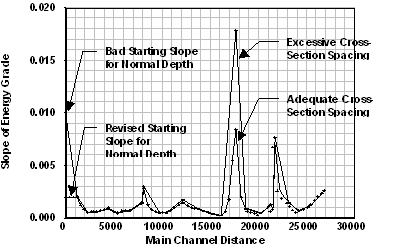
Excessive change in the computed velocity head is another indication of excessive cross-section spacing.
Increasing the Accuracy of Topographic Data
Since the HEC research [USACE, 1986] indicates that the biggest source of uncertainty in the use of topographic data for water surface profile computation is the lack of an adequate number of cross-sections, it is logical to conclude that one of the best ways to reduce the uncertainty of a computed water surface profile is to obtain more cross-sections. This is true even if the data points that make up each of the new cross-sections are actually less accurate.
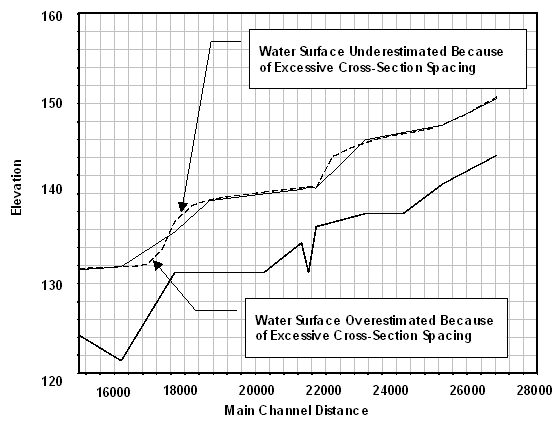
Figure 3 illustrates two actual computed water surface profiles for the same stream channel. One profile (the solid line) was computed with cross-sections that were made up of highly accurate data points, but the cross-sections were spaced too far apart. The excessive reach lengths caused the HEC-RAS program to "overshoot" the actual water surface profile. When more cross-sections were added, the profile computation became much more accurate, in spite of the fact that the data points used for the additional cross-sections were taken from relatively low-quality sources of topographic data. The dashed line shows the more accurate water surface profile.
The importance of having an adequate number of cross-sections has some implications for the selection of input data sources and data preparation methods for a HEC-RAS analysis. The ideal data source would provide the following characteristics:
A combination of traditional field survey methods (for channel cross-sections and hydraulic structures) and remote sensing (either traditional aerial photogrammetry or LIDAR) for floodplain areas meets these requirements very well.
A combination of GIS StreamPro software, when used with ArcView, ArcView 3D Analyst, and HEC-RAS, meets these requirements very well.
Human Errors in Data Entry
In addition to the important issue of providing an adequate number of cross-sections for the analysis, the possibility of human error during data preparation, and data entry, must be considered.
From human error research in general, we know that error is present in all cognitive processes [Baars, 1992; Reason, 1990]. Human cognitive processes are very fast and flexible, but their methods of operation inherently produce a small error rate.
Research in other human cognitive activities indicates that errors are not merely inevitable; they are actually predictable. Research has produced human error data from a large number of experiments and real world incidents across many types of human cognitive activity. These data collectively suggest that human beings have a natural uncorrected error rate that ranges from about 1 error per 1,000 operations (0.1%) up to about 1 error per 10 operations (10%), with an average of about 1 error per 100 operations (1%). Of course the error rate will depend on the task, as will the error detection and correction rate. The level of experience of the person performing the task has some influence on the rate of errors, but even an experienced person makes errors. Research indicates that the error rates of novices and experts are different, but not dramatically different.
Therefore, the only question is the rate of uncorrected errors, that is, errors that are not detected and fixed by people as they work. Studies in statistics problem solving [Allwood, 1984] and writing [Hayes & Flower, 1980] indicate that people both detect and correct errors as they go along. People also occasionally perform more systematic error checking episodes, in which they go back over their work before they finish. They also miss many of their errors. For simple slips, the detection and correction rate is over 90%. For more complex errors, the detection and correction rate is much lower. Experts do not have a dramatically higher rate of error detention and correction than do novices [Galletta, et al, 1993], [Grudin, 1983].
Computer programmers have to spend about a third of the total development time on systematic error checking after development. Otherwise, programs will have an unacceptably high number of errors upon delivery. Often, this systematic error checking takes the form of team code inspection [Fagan, 1976]. Team code inspection is used because both experiments and field experience have shown that individual inspectors will not catch a large fraction of all programming errors [Basili and Selby, 1986], [Myers, 1976].
Technique for Human Error Prediction (THERP)
Therefore, we should expect that human beings, if given the responsibility of processing and entering a large amount of data for a floodplain analysis, will make some mistakes. How many mistakes? This section will describe a method of providing an estimate.
The study of human errors is called Human Reliability Analysis, and one of the most popular quantitative methods of HRA is the Technique for Human Error Rate Prediction (THERP). THERP was originally developed at the Sandia Laboratories in the 1950s as a way of analyzing the risks involved in the assembly of nuclear weapons [Swain and Guttman, 1983]. THERP provides a mechanism for modeling as well as quantifying human error. THERP involves the following steps:
The basis of THERP is the assumption that particular types of errors, such as reading or omitting an instructional step, are presumed to occur at constant rates. If the tasks that a person performs can be broken down into subtasks for which these types of errors can be predicted, then the probability of the successful completion of the overall task can be predicted.
The database of error rates used by THERP have evolved over a 30 year period based on a combination of statistical data and expert judgment and are presumed to be accurate within an order of magnitude. When studies have been conducted to verify this assumption, estimates are usually found to be much closer, varying by factors of 2 or 3 rather than 10.
A complete THERP study is very comprehensive, and is not required for this analysis. However, a preliminary study of the potential for error in manual data entry of cross-section data could provide useful information.
There are three basic operations that may be required for HEC-RAS data entry. According to available published data, each of these three operations have dramatically different human error rates:
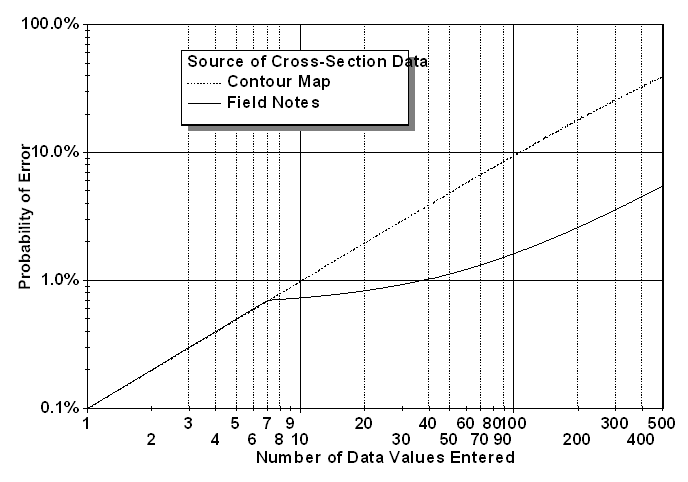
The error rates for each of these operations may be estimated from available HRA authorities. For example, Table 5-17 (page 134) of [Gertman and Blackman, 1994] lists several measured error rates for reading and recording values from analog meters, digital meters, chart recorders, and graphs. These error rates range from 0.1% for digital meters up to 5% for a printing recorder with a large number of parameters. A contour map is assumed to be equivalent to a "graph", which has an estimated error rate of 1%, whereas a printed or tabulated data source is assumed to be equivalent to a "digital meter" which has an error rate of 0.1%. Direct data transfer is assumed to have a data entry error rate near zero.
In spite of the low rate of error at each step, however, the probability of error increases tremendously because of the large number of input data values required for most cross-sections. As Figure 4 indicates, the probability of human error in manually entering the data for one cross-section is between 2% and 10%, assuming that the cross-section includes about 100 ground coordinates. For the maximum cross-section size currently supported by HEC-RAS (500 points), the expected probability of errors in a cross-section would rise to the range of 5% to 50%, depending on the data source.
Figure 4 Probability of Human Error During Cross-Section Data Entry
This paper has presented a comparison of two methods of performing floodplain studies: a traditional method that involves a great deal of manual data entry, and an automated method that uses GIS StreamPro, a software product distributed by Dodson & Associates, Inc. and designed to work seamlessly with ArcView, ArcView 3D Analyst, and the U.S. Army Corps of Engineers HEC-RAS River Analysis System.
A case study showed that GIS StreamPro eliminates about 2/3 of the effort required to perform a floodplain study, even though the use of GIS StreamPro requires the preparation of a TIN model for the study area. The primary efficiency advantages of GIS StreamPro are in the elimination of time-consuming steps such as data entry and manual floodplain mapping.
GIS StreamPro provides another significant efficiency advantage: recomputing floodplain elevations and remapping floodplain boundaries is fully automated and can be redone almost immediately.
An analysis of accuracy considerations showed that, without GIS StreamPro, human errors may be expected in 1% to 10% of all normal cross-sections (and more errors in longer cross-sections). However, since GIS StreamPro provides for direct data transfer to HEC-RAS, human errors are practically eliminated.
GIS StreamPro provides another accuracy advantage: inserting additional cross-sections to eliminate excessive reach lengths is very easy. The ability to quickly and easily insert additional cross-sections addresses one of the major sources of error in computed water surface profiles: excessive cross-section spacing due to poor initial cross-section layout and/or an inadequate number of available cross-sections.
Baars, B. J. (Ed.), Experimental Slips and Human Error, New York" Plenum, 1992.
Basili, V. R. & Selby, R. W., Jr. "Four Applications of a Software Data Collection and Analysis Methodology," in J. K. Skwirzynski (ed.) Software System Design Methods, Springer-Verlag, Berlin, 1986.
Fagan, M. E. "Design and Code Inspections to Reduce Errors in Program Development," IBM Systems Journal (15:3) 1976, pp. 182-211.
Freeman, Copeland, and Cowan 1996 Freeman, G. E., Copeland, R. R., and Cowan, M. A. 1996. "Uncertainty in Stage-Discharge Relationships." Proceedings, 7th IAHR International Symposium on Stochastic Hydraulics, Mackay, Queensland, Australia, IAHR. (in publication).
Galletta, D. F.; Abraham, D.; El Louadi, M.; Lekse, W.; Pollalis, Y. A.; & Sampler, J. L. "An Empirical Study of Spreadsheet Error-Finding Performance," Accounting Management Information Technology (3:2) 1993.
Gertman, David I., and Harold S. Blackman, "Human Reliability & Safety Analysis Data Handbook," John Wiley & Sons, Inc., New York, 1994.
Grudin, J. T. "Error Patterns in Novice and Skilled Transcription Typing," Chapter 6 in W. E. Cooper (Ed.) Cognitive Aspects of Skilled Typewriting, Springer-Verlag, New York, 1983, pp. 121-143.
Hayes, J.R. & Flower, L.S., "Identifying the Organization of Writing Processes," in L. Gregg & E. Steinberg (Eds.), Cognitive Processes in Writing, pp. 3-30, Hillsdale, NJ: Erlbaum, 1980.
Myers, G. J. "A Controlled Experiment in Program Testing and Code Walkthroughs/Inspections," Communications of the ACM (21:9) September 1978, pp. 760-768.
Reason, J. Human Error, Cambridge University Press, Cambridge, UK, 1990.
Swain, A. D. & Guttman, H. E. Handbook of Human Reliability Analysis with Emphasis on Nuclear Power Plant Applications. (Draft report for interim use and comment) Technical Report NUREG/CR-1278, U.S. Nuclear Regulatory Commission, Washington, DC, October 1980. Cited in B. Kantowitz & R. D. Rorkin, Human Factors: Understanding People-System Relationships, John Wiley & Sons, New York, 1983.
U.S. Army Corps of Engineers (USACE). "Accuracy of Computed Water Surface Profiles." Research Document 26, Hydrologic Engineering Center, Davis, CA, 1986.
U.S. Army Corps of Engineers (USACE). "HEC-RAS River Analysis System Version 2.2 Users Manual, Hydrologic Engineering Center, Davis, CA, 1998.