Xinhao Wang, Shaoli Huang and Changming Du
Abstract: The threat of flooding is a serious concern to local governments that are responsible for flood warning and flood damage reduction. This paper presents a study that provides an effective flood warning system. GIS, hydrologic models, emergency response strategies, and expert knowledge are integrated in this system. Typical application begins with an interactive user input of water levels and area of interest, and the system returns text, maps and graphics of the delineated area of potential flooding. The system will also include a reporting tool for attribute listing and notification and a plotting tool for simple map generation.
Cincinnati is a city along the bank of Ohio River. The threat of flooding to properties and people’s lives has always been part of the City's history. The first recorded flooding was in 1773, which marked the depth at 76 feet. A little more than a century later, Mount Washington and Newtown were cut off from the rest of the city during the flood (71.1 feet) in 1884. The highest-ever level of Ohio River, 79.9 feet, was recorded in 1937, during which about 100,000 people were left homeless. The most recent flooding event was in March 1997 when the Ohio River rose to 64.7 feet. Traffic was jammed with drivers trying to find a detour around the town and a boat was the only way around some parts of downtown Cincinnati (Cincinnati Enquirer, 1997). During the 1997 event, there was a great demand for geographic information among city agencies as well as private organizations for the relief efforts. The Cincinnati Area Geographic Information System (CAGIS), which maintains an active GIS database for both Cincinnati and Hamilton County, received numerous requests for maps showing the effected facilities and properties. In some cases, CAGIS staff was unable to respond to the requests as quickly. This experience leads to this project – development of a flood warning system that is available to agencies and general public using the Internet technology.
The Flood Warning Information System is meant primarily for use by local governments that are responsible for flood warning and flood damage reduction. During a flooding event, it is critical to get accurate estimate of where and how much the impacts are and ultimately how quick and effective the emergency response can be. In addition, it is possible for people who live in the flood-prone area to be informed of the potential impact of a flood to their properties.
Increasingly, Geographic Information System (GIS) technology has been used by communities to forecast and manage such emergency events. The development of a flood warning system requires the understanding of water flow and land surface features. An effective system should integrate GIS, effective emergency response strategies, and expert knowledge in one system. We chose three most frequently requests as the focus of this study: the flooding impact areas and the buildings and streets within the areas. Several design principles were defined to guide our study: The final product should be user friendly with customized interface and scripts to support the "click and run" interface for most tasks. It should take advantage of the accuracy of the CAGIS database. It should produce both maps of the area of interest and attributes of the building and street features. The World Wide Web (WWW) and the Internet have the potential in improving accessibility to spatial data and to spatial data processing services (Abel et al., 1998). Discussions in the literature have shown that the WWW can be employed as a distribution mechanism for GIS-based applications (Doyle et al., 1998). An important feature of this Internet-based flood warning system is that a user can access the system over the WWW. It provides wide and easy accessibility while database can be centrally maintained. Another benefit is that there is no need to install a single version of the system on each user's computer.
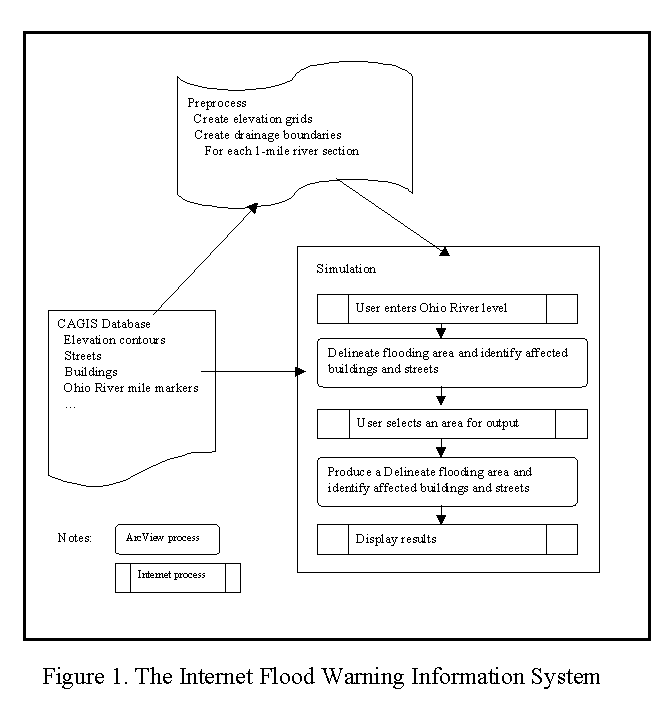
The structure of the flood warning information system is displayed in Fig. 1. The system is dynamically linked to the street and building data layers in the CAGIS database. At the preprocess stage, a series elevation grids are generated from the contour and other elevation point or line files. Those grids correspond to the river mile markers along the Ohio River. The river mile markers represent the location at each mile point. Once a user lunches the system, he or she will be prompted to enter the water level of Ohio River at mile marker 471 in downtown Cincinnati. This value should be the reading from the National Weather Service station. The system then will derive the flooding areas at this water level. The flooding area data is overlaid with building and street data layers to identify the buildings and streets within the flooding areas. Next the user will define an area of interest for mapping and report and require the system to produce a map and/or a table on the screen. The user interface is implemented with Internet and the process is executed with ArcView. We choose the Internet user interface because it helps solving the limitation of a traditional decision support system that stores data, model, and user interface on a single computer (Bhargava and Tettelbach, 1997). Developing an Internet-based GIS will provide and require easy access and share geographic data (Peng and Nebert, 1997).

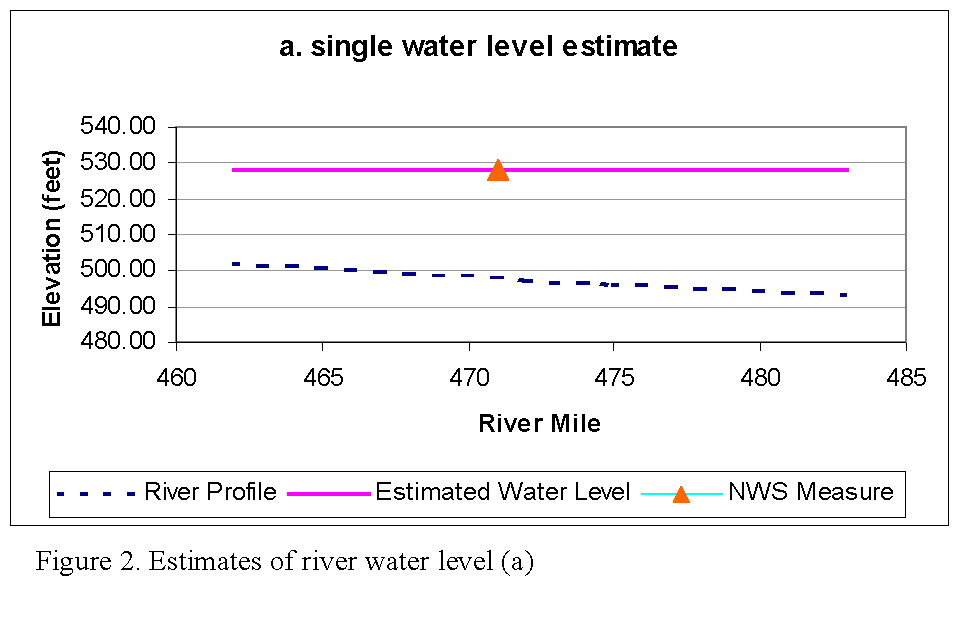
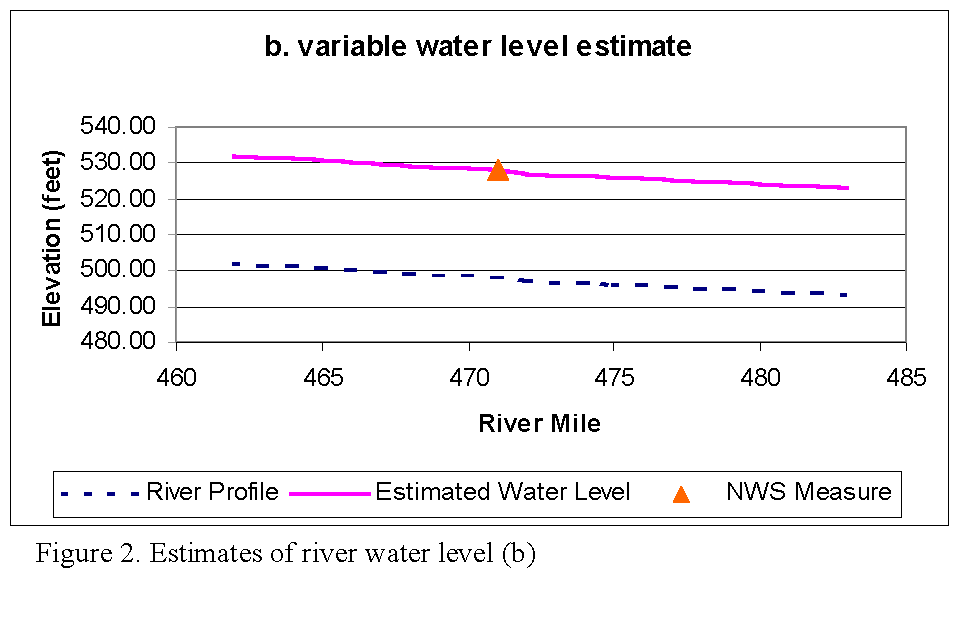
There is only one NWS station measuring water level in Hamilton County portion of the Ohio River while the difference of river water levels in this section is about 8 feet. The flooding area above the monitoring site could be underestimated the area below the site could be overestimated as a result of the natural gradient of the river (Fig. 2a). To reduce such an error from using one water level for the 20-mile section of Ohio River, we used the water level measurements at different river miles as references to estimate the water levels during a flooding event by assuming river water levels raise same amount from the original level (Fig. 2b). Then the water level for each river mile is compared with land surface elevations to delineate the flooding areas. We have applied two criteria for identifying the flooding area. First, area where elevation is below the water level is selected as potential flood prone areas. After those flood prone areas are merged into larger polygons, those polygons that are connected to the Ohio River are further selected as flooding areas. Finally, streets and buildings within the flooding areas are selected.
 SYSTEM OPERATION
The system was developed with ArcView, its Spatial Analyst extension and the ArcView Internet Map Server, all products of the Esri, Inc. Several GIS functions were used in this flood warning information system. The system development consists of four steps as shown in Fig. 3: 1) Creating surface elevation grids; 2) Delineating flooding areas for a specified river level at the National Weather Services station; 3) Identifying streets and buildings that are within the flooding area; and 4) Developing a user interface. The following are the discussions for each step.
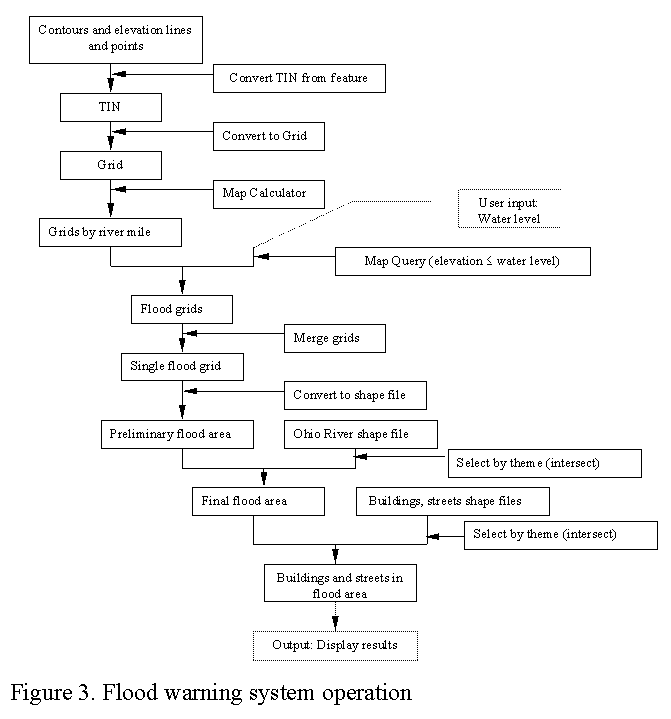
We created an elevation grid from several data files. A two-foot contour was used to cover the downtown Cincinnati area and a ten-foot contour was used for area outside the City. In addition, dams and levies were represented as barriers. We first created a TIN using those data files as input and then created an elevation grid from the TIN with a 10-foot grid size. We took this step to ensure that the grid can accurately reflect the land surface to allow precise delineation of flooding area. From this grid we extracted a grid that includes areas that are potentially subject to flooding threat. The historical record shows that the highest water level was 79.9 feet in 1937. This can be converted into about 510 feet elevation. Therefore in the new elevation grid we included only the areas where elevation is less than 530 feet. This treatment substantially reduced the file size of the elevation grid to be used in the system. The new elevation grid was divided into several smaller grids, one for each one-mile river section.
A flooding area is the area where is below water during a flood event. This could be a result from a locally concentrated heavy rainfall or from precipitation from upstream areas. The former usually reflects smaller streams and the latter usually happens for large rivers. The literature shows formulas that can be used to simulate river over-bank flooding. In this study we choose to begin with a simple approach which delineates flooding area for Ohio River only without using hydraulic formula. The rationale is that most several flooding problems most likely are along the Ohio River as a result of rainfalls in areas above Cincinnati. Such flooding often lasts a prolonged period that the river provides enough water to flood to any adjacent area where is lower than the water level. We further assume that water rises same amount in different sections of the Ohio River from its normal level. With these assumptions we first calculated the flood water elevation for each one-mile section and then compare the corresponding elevation grid with these water levels. Any area where the elevation is below the water level and without any barriers to the river bank is considered as flooding area.
The most frequently queries regarding flood impact are the properties affected and streets that have to be closed. Presently we choose these two data layers for reporting. The CAGIS database maintains the most recent building footprints for the study area. The attribute data for the buildings are currently updated and checked for accuracy. Once the data layer is completed, the flooding warning information system will be able to list the addresses for those buildings that are within the identified flood area. Similar to the building data layer, the street centerline file is a shape file as part of the CAGIS database and the address ranges are maintained in the attribute file. We used the ArcView Them-on-theme selection function to select the street segments that are within the flood area. The address ranges of those street segments are kept in a separate file that can be called by the user to be displayed on the user's screen.
The user interface was developed with ArcView Internet Map Server. The ArcView IMS provides the necessary link between the flood warning system and a user. ArcView experience is not required to use the system. Fig. 4 is a snap shot of this user interface through which a user may specify the water level reading from the National Weather Station monitoring station. After executing the flooding area delineation, the system draws the flooding area on the screen (Fig. 5). The user may use the zoom in, zoom out and pan buttons to define an area of interest. The user may choose to use the identify button to popup attributes for a particular building or a street segment. The attribute table button will list attributes for buildings or streets, depending on which data layer is active. After the user points to the center of the map the system will zoom in to the area and prepare a map with 1:4,000 scale. Attributes of the buildings or street segments displayed on the map are listed below the map (Fig. 6).
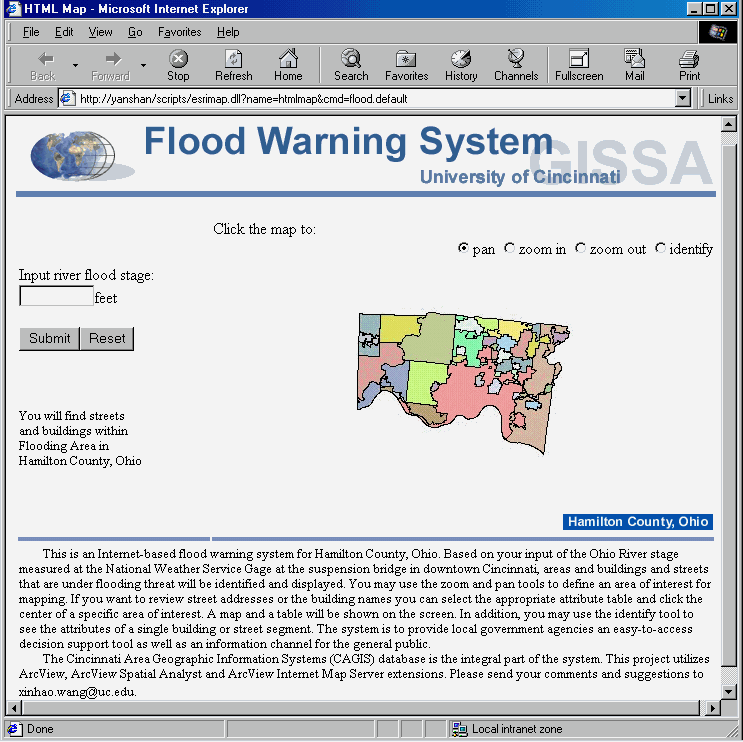
Figure 4. User Interface
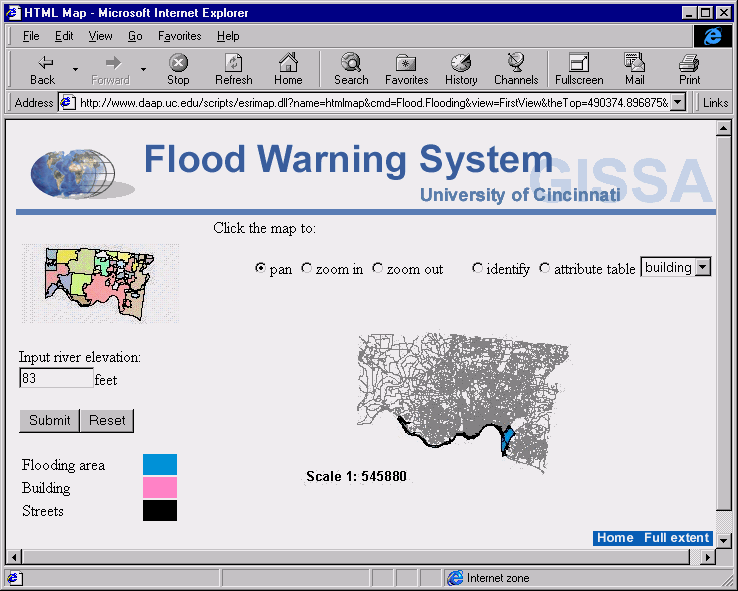
Figure 5. Delineated flooding area
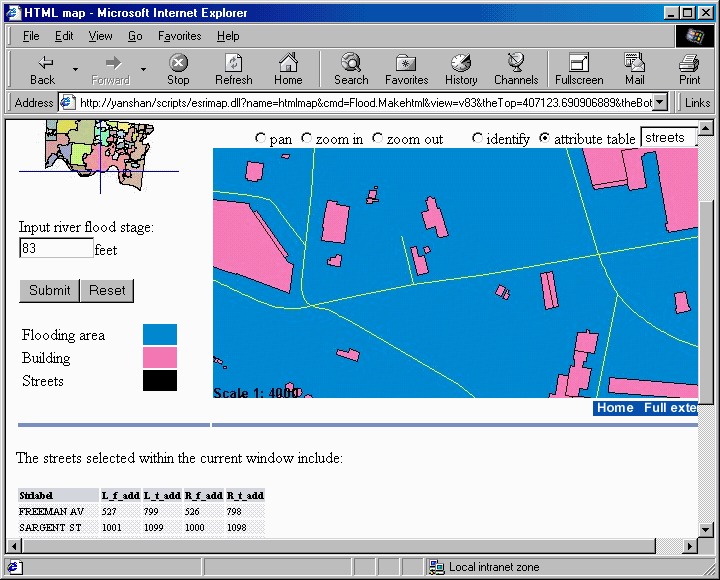
Figure 6. Zoomed-in map and attribute table
The flooding warning system is designed to achieve with high efficiency. The time taken for the simulation depends on the cell size of the elevation grid and number of river segments. To improve the efficiency the system saves the result for each water level specified by a user. When another user queries about the same water level, the results are retrieved into the system and sent to the browser almost instantaneously.
Data used to develop the system include 1) the surface elevation; 2) the Ohio River boundary, 3) observed records of water level by the National Weather Service; 4) street centerlines with street name and address ranges; and 5) buildings and properties and related attribute data. The system provides both macro and micro models for the application. The macro model includes a graphic overview of the flooding areas for the entire study area. The micro model provides a finer look at a smaller area under the projected flood impact with maps and tables. A user may select a small area of interest for lists of detailed information, including building names and street address ranges.
This system will be added to the CAGIS Map Server and is available to all government agencies. Certain agencies, such as the Metropolitan Sewer District (MSD) of Hamilton County, are likely to utilize the system more than the others. It is also hoped that general public can also use this system to assess the potential risk of flooding during a flooding event. Future improvements of the flooding warning system include collaborating with the National Weather Service to obtain a more accurate river profile of Ohio River along Hamilton County, adding more feature layers to the system, and utilizing state of the art internet mapping technology as such technology becomes more sophisticated. Finally, tributary streams may also be incorporated into this system for tributary flooding analysis as the direct result of Ohio River flooding.
Map server and Web server are installed on the same computer.
Those who are interested may run the system by clicking here.
Abel, Daved, Kerry Taylor, Ross Ackland and Stuart Hungerford, 1998. An Exploration of GIS Architectures for Internet Environments, Computer, Environment and Urban Sytems, Vol 22, No.1, pp.7-23.
Bhargava, Hermant and Clay Tettelbach. 1997. A Web-based Decision Support System for Waste Disposal and Recycling, Computer, Environment and Urban Sytems, Vol 21, No.1, pp.47-65.
Doyle, Simon, Martin Dodge, and Andy Smith. 1998. The potential of web-based mapping and virtual reality technologies for modelling urban environments, Computer, Environment, and Urban Systems Vol 22, No 2, pp137-55.
Enquirer research. 1997. "Infamous Floods", The Cincinnati Enquirer. March 16, pp.20-21.
Peng, Zhong-Ren and Douglas Nebert, 1997. An Internet-Based GIS Data Access System, Journal of the Urban and Regional Information Systems Association, Vol 9, No 1, pp.20-30.
Xinhao Wang
School of Planning
University of Cincinnati
Cincinnati, OH 45221-0016
Phone: 513-556-0497
Fax: 513-556-1274
Email: xinhao.wang@uc.edu
Shaoli Huang
Cincinnati Area Geographic Information Systems
10th Floor, County Administration Building
138 East Court Street
Cincinnati, OH 45202
Phone: 513-352-1969
Fax: 513-352-3557
Email: shaoli.huang@cagis.rcc.org
Changming Du
School of Planning
University of Cincinnati
Cincinnati, OH 45221-0016