The Role of GIS in Acid Rain Program
Assessment
Abstract
The primary goal behind the development
of a GIS for the U.S. EPA's Acid Rain Program is to gain a thorough understanding
of the impacts of sulfur dioxide and nitrogen oxide emission reductions
to the environment. The decision to implement a GIS stemmed from a need
to better understand the implications of policy questions regarding acid
rain control, and therefore to improve the decision-making process. GIS
is a unique analysis tool to support this effort by visually integrating
environmental, ecological and other data to assess the overall impacts
of emission reductions which are national or regional in nature.
Acid Rain Program Background
The U.S. Environmental Protection Agency's Acid Rain Program, established in 1990 by Title IV of the Clean Air Act Amendments, calls for major reductions of annual sulfur dioxide (SO2) and nitrogen oxide (NOx) emissions, the pollutants that cause acid rain. In an innovative approach to environmental protection, the SO2 portion of the program uses market incentives to achieve a nationwide limit on SO2 emissions more cost effectively than traditional regulatory methods. This market-based program utilizes a system of tradable emission allowances. Each SO2 allowance is an authorization to emit one ton of SO2 in a given year. Existing utility sources were allocated allowances for each compliance year based on performance rates and actual utilization. Allowances have a specific use year, making them valid for surrender during that year or any future year. At the end of each year, each source must retire, or surrender to EPA, as many allowances as tons of SO2 emitted that year. Excess allowances may be banked for use in future years, or sold, often to offset costs of pollution controls. This creation of market incentives attaches a clear monetary value to emissions reductions, thereby providing utilities economic incentive to cut their SO2 emissions.
The SO2 portion of the Acid
Rain Program requires a two-phased tightening of restrictions on fossil-fuel
fired power plants, eventually resulting in a permanent cap on SO2
at 8.95 million tons nationwide (2010), half the amount emitted in 1980.
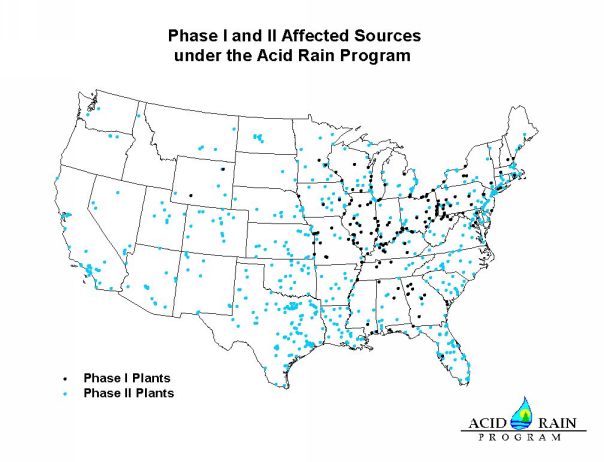
Phase I runs from 1995-1999 and affects roughly 440 of the larger, higher
emitting utility boilers, or units, primarily in the Eastern U.S. Phase
II begins in 2000 and extends to over 2,000 units throughout the country.
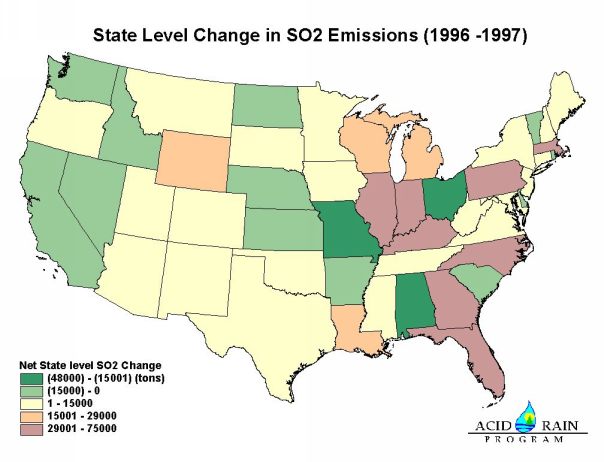
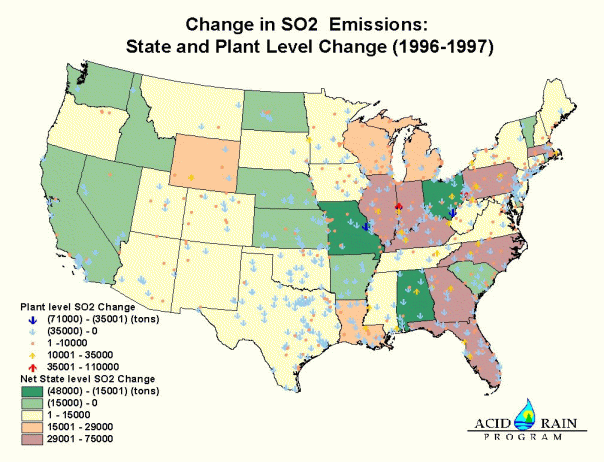
The first three years of the program have produced extra SO2
reductions in almost every affected state; utilities overall have been
reducing emissions in excess of their allowance allocation. Most are banking
the unused allowances for future use, when pollution restrictions are tighter.
These extra reductions in the early part of the program have allowed environmental
recovery to begin sooner. GIS is being implemented as a tool to assist
us in assessing the overall impacts of these emission reductions to the
environment.

Multiple Benefits of Reducing Acid Rain
Air pollution from the burning of fossil fuels is the major cause of acid rain. Acid rain occurs when emissions of sulfur dioxide and nitrogen oxides react in the atmosphere with water, oxygen, and oxidants to form acidic compounds. These compounds then fall to the earth in either wet form (such as rain, snow, and fog) or dry form (such as gas and particles). The combination of acid rain plus dry particles, is called acid deposition. Prevailing winds transport the compounds, sometimes hundreds of miles, across state and national borders. Electric utility plants account for about two thirds of annual SO2 emissions and one third of NOx emissions in the United States (National Air Quality and Emissions Trends Report, 1997, U.S. EPA, Office of Air and Radiation, EPA Document Number 454/R-98-016).
Acid rain causes significant damage to human health and the environment. Implementation of the Acid Rain Program under the 1990 Clean Air Act Amendments will confer significant benefits on the nation. By reducing SO2 and NOx, many acidified lakes and streams will improve substantially so that they can once again support fish life. Visibility will improve, allowing for increased enjoyment of scenic vistas across our country, particularly in National Parks. Stress to forests all along the east coast will be reduced. Deterioration of historic buildings and monuments will be slowed. Finally, reductions in SO2 and NOx will reduce sulfates, nitrates, and ground level ozone (smog), leading to improvements in public health (The National Acid Precipitation Assessment Program: 1990 Integrated Assessment Report). There are multiple benefits of reducing acid rain; due to the many receptors in which to track ecological and other responses to current air pollution control strategies, GIS is a unique tool in which to do so effectively.
Understanding the environmental responsetothese
emission reductions is one of the most elusive and important questions
remaining. There was a significant drop in emissions beginning in 1995,
the first year of the program. As Phase II reductions begin in 2000, leading
to even more substantial reductions in SO2 and NOX
emissions, the ability to describe the ecological response becomes increasingly
important in determining whether current control levels provide adequate
protection to human health and the environment.
GIS Program Background
Over the past year, the U.S. EPA's Acid Rain Program has been developing a Geographic Information System (GIS) to be used as a primary analysis tool to explore the spatial patterns, relationships, and trends of various types of environmental data. Because of the national cap and trade component of the SO2 portion of the program, large, regional reductions are occurring in magnitudes larger than expected. The geographic component of GIS is essential to understanding overall effects of the Acid Rain Program; not only in the determination of where reductions are occurring, but also in detecting both improvements or potentially worsening conditions resulting from emissions transport. The desire to develop a GIS stemmed from a need to assess the impacts of these large reductions in emissions, and to report results in a geographical context, easily understandable by the public. GIS allows spatial analysis of different types of data (such as emissions, acid deposition, surface water quality, visibility, forest ecosystems and human health), facilitating visual understanding of the inter-relationships between the various data sets.
GIS Goals in the Acid Rain Program
1. Provide quality data for integrated assessment of trends
1.1 Database Development
One of the most important components of a GIS is the database. The initial stages of GIS development entailed a needs assessment. Data sets from specific national or regional monitoring programs most relevant to Acid Rain Program assessment were identified and targeted for collection. The most significant data sets include trends in emissions, allowance trading, deposition, surface water chemistry, ambient SO2 and SO4 concentrations, visibility, forest ecosystems and human health effects. Table 1 contains the current GIS data components.
Within each of these impact areas are various environmental indicators of interest, changes in which can be used to better understand regional or localized trends. Examples of this attribute data include parameters such as ambient sulfate, nitrate, or particulate matter (SO4, NO3, or PM10), pH, and Acid Neutralizing Capacity (ANC ) levels. Understanding trends in such indicators over time is critical to understanding overall ecosystem health, characterizing regional or localized improvement to sensitive ecosystems, as well as identifying potentially vulnerable geographic hot spots.
Future data additions include demographic information, elevation, meteorology, and integration of air pollution modeling outputs.
Table 1: Primary
GIS Database Components
| AREA OF INTEREST/IMPACT AREA | DATA SOURCE | DESCRIPTION |
| Emissions, Allowances,
and locational coordinates
|
ETS, ATS, ARDB
|
EPA's Emissions Tracking System (ETS) houses emissions data (SO2, NOx, CO2, fuel usage) submitted quarterly by the electric utility industry. The Allowance Tracking System (ATS) tracks all aspects of SO2 allowance allocation information and trading activity. The Acid Rain Database (ARDB) includes latitude/longitude coordinates for all Acid Rain affected sources, as well as historic and estimated future emissions trends. |
| Acid Deposition
|
NADP
|
The NADP/NTN database (National Acid Deposition Program/National Trends Network) is the national repository for wet deposition data. The wet deposition indicators (SO4, NO3, NH4, and H+) are most relevant for the eastern United States, where the majority of Title IV emission reductions have been implemented. |
| Water Quality
http://www.usgs.gov/ (water) |
USGS-HBN | The USGS-HBN database (US Geological Survey-Hydrologic Benchmark Network) provides national coverage of surface water indicators in relatively small, minimally-disturbed watersheds. Monitoring data from these streams can be used to investigate naturally-induced changes in water quality and the effects of airborne pollutants. |
| Water Quality
|
EMAP-LTM/tIME | The EMAP databases (Environmental Monitoring and Assessment Program) provide national coverage of surface water indicators in lakes and streams. Specifically, the LTM (Long-Term Monitoring) data are collected monthly to capture water chemistry trends and seasonal variations in selected acid-sensitive regions. The TIME (Temporally Integrated Monitoring of Ecosystems) program collects samples on a four-year cycle and is not intended to focus on individual surface waters, but to provide a broad, regional pattern of acid-sensitive ecosystem status. |
| Ambient Pollutant
Concentrations
|
AIRS | The AIRS database (Aerometric Information Retrieval System), maintained by the EPA Office of Air Quality Planning and Standards, is the repository for national ambient air quality data. AIRS monitoring sites (NAMS and SLAMS) collect SO2, NO2 and particulate data which can be used to directly evaluate the air quality effects of Title IV. Example uses of AIRS data include comparison of ambient SO2 trends with emissions trends, and comparison of NO2 concentrations with ozone non-attainment areas. (Current GIS data includes only ambient SO2 concentrations). |
| Visibility
|
IMPROVE | The IMPROVE database (Interagency Monitoring of Protected Environments) provides national coverage of visibility indicators at National Park sites. The data for this program may be divided into subsets: western parks and eastern parks. The majority of park land is located in the West. |
| Forest Health
|
FHM | The FHM Program (Forest Health Monitoring) provides national coverage of forest health indicators. These indicators may not be immediately responsive to changes in acid deposition rates, but they can illustrate trends in forest health over time. |
1.2 System and Data Quality Assurance/Quality Control
Other than the emissions and allowance data which is maintained by the Acid Rain Program, the databases collected for use in the GIS are maintained by third parties (i.e., the National Park Service, the US Geological Survey, EPA/OAQPS, etc.). In order to ensure data integrity, it is necessary both to perform some degree of QA/QC checking (which is dependent upon many factors such as time, available resources, type and scale of analysis to be performed), as well as ongoing data maintenance (Table 2).
Table 2: General QA/QC
objectives
| QA/QC OBJECTIVE | PURPOSE |
| data completeness | to verify the existence or absence of data |
| data validity | to verify all attribute values are unique, and not nil |
| logical and physical consistency | to check for temporal consistency, topological correctness |
| referential integrity | to verify the database does not contain any unmatched values |
| positional accuracy | to compare database locations to real world locations |
| attribute accuracy | to compare database attributes to real world attributes |
| formatting accuracy | to verify that the database is formatted correctly with all specified elements |
| data/documentation error identification | to identify data or documentation that do not conform to above criteria |
1.3 Data Storage and Maintenance
The database must be maintained on an ongoing basis to ensure data reliability and integrity, to keep abreast of potential hardware/software issues, and to safeguard that any database modifications are intentional. To the extent possible, it is important to maintain standardization of units and sampling periods for meaningful comparisons of data and trends. This effort also involves data updates and assurance that the data and metadata meet national standards for publishing (consistent with the National Spatial Data Infrastructure, as put forth by the Federal Geographic Data Committee).
Over the next year, considerable effort
will be devoted to database quality assurance, maintenance, and documentation
of results. Much of the previous year's effort focused on targeting relevant
databases for collection, obtaining and formatting the data to a standard
projection such that all of the data sets could be used together in the
ArcView project. Since the data quality was only reviewed on a cursory
level (visually, as well as cross-checked with other similar data sets)
the upcoming year's effort will be devoted to a more thorough quality checking
and standardization exercise, both of the data and of the system as a whole.
Once EPA is satisfied that the system and data structure meet the determined
level of quality assurance, EPA will look toward developing a Web-based
application to make the data and ensuing analyses accessible for browsing
and query by the public.
2. Perform exploratory analysis of policy-relevant questions
Another powerful use of GIS is to explore questions regarding acid rain control, in the context of public policy. Using GIS, we can better understand the environmental effectiveness of current air pollution reduction strategies. It helps us answer questions such as, "Are current pollution control strategies sufficient to protect public health and the environment?" "Is this answer geographically distinct?" and "If so, what further steps may need to be taken in those areas?"
2.1 Potential Uses for GIS:
Analysis of trends in ecological indicators and ecosystem effects resulting from emission reductions is one primary use of the GIS. Data from the national monitoring programs discussed earlier may be used to:


Analysis of the impacts of the Acid Rain Program on human health is another important use of the GIS. Possible applications include:
2.2 Types of policy questions
to be explored using GIS
Using GIS, we can better understand the environmental effectiveness of current air pollution reduction strategies in order to determine if further pollution control steps may be necessary.
Overall ecosystem health:
Trading is regarded as a cost-effective approach to achieving early reductions, with cost savings resulting from the program's flexibility measures. However, it has also become a source of contention to certain stakeholders regarding the fear that it will result in an unfair aggregation of pollution in certain geographic regions, specifically the Northeast. The concern voiced is that other local or regional emission reduction strategies will be offset if "downwind" utilities (Northeastern region) sell allowances to "upwind" utilities (Midwestern region). The idea being that instead of instituting emission controls, Midwestern utilities in upwind states will purchase allowances heavily, allowing emissions to rise. Due to meteorological and atmospheric conditions, the pollutants emitted upwind are expected to result in harmful atmospheric deposition effects in downwind states.
The concern over this issue highlights the importance of analyzing the true impacts of trading on the environment. The power of GIS lies not only in its cartographic ability to display data geographically, but also in its powerful analytical abilities. GIS allows us to look at this important matter geographically, to determine whether trading is, in fact, resulting in a regional shifting of emissions. The Acid Rain Program performed an analysis to assess how SO2 allowance trading is affecting emissions patterns around the country.
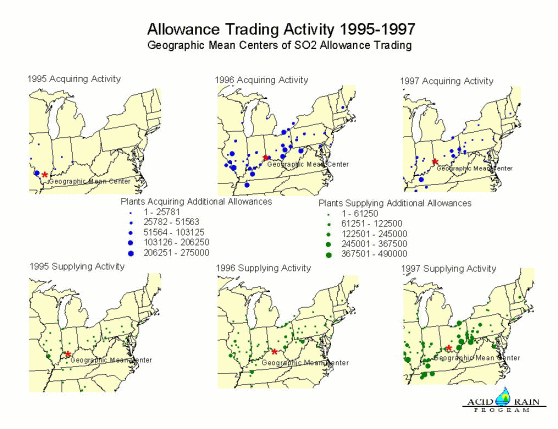
For a given compliance year (1995, 1996, and 1997), this analysis identified those plants emitting more than their allocation for that year. Thus, those plants surrendering additional allowances acquired those allowances through the SO2 market mechanism (plants acquiring additional allowances). Since these plants were acquiring additional allowances, the next step was to identify the source plants that were originally allocated those allowances (plants supplying the allowances). We then identified the origin and magnitude of the additional allowances acquired.
Since the environmental impact of the allowance (i.e., the emissions) is associated with the facility surrendering it, the net flow of trade only is considered in the analysis. Interim trading activity is not accounted for since interim trading has no resulting environmental impact. For example, Plant 1 in Pennsylvania, trades to Plant 2 in Florida. Plant 2 then trades to Plant 3 in Virginia, who surrenders the allowance that year. The environmental impact is associated with the surrendering plant in Virginia; the net trade is between the source plant in Pennsylvania and the retiring plant in Virginia. The relationship thus analyzed is that of the plant retiring the allowance and the associated plant of origin.
The plants acquiring additional allowances and the plants supplying those allowances were then plotted using ArcView 3.1. Finally, using Avenue, the geographic mean centers of acquiring and supplying activity were calculated, weighted by the number of allowances acquired and supplied, to determine the geographic centers of trading activity for each compliance year.

Results:
The analysis revealed that the overwhelming majority of allowances were retired in the same state in which they were originally allocated. The geographic centers of trading were very close to each other (within approximately 200 miles), and remained concentrated in the Midwest for all three years. Interestingly, not only were the centers of acquiring additional allowances in the Midwest, but also the centers of supplying activity. The analysis reveals that not only were the high emitters more concentrated in the Mid-west, as expected, but also the units that supplied the additional allowances.
This proximity of trading centers indicates that there was no significant shifting of emissions from one region to another among these units. The tight geographic correlation corroborates EPA's observations that units tend to acquire additional allowances from within their own company (or geographic region). It should be noted, however, that many factors are involved in deciding which allowances to retire for any given plant, in any given year. Considerations such as taxes, allowance use year, overall system compliance costs, etc. all play a role. This analysis provides us a better understanding of the geographic aspect of trading activity. Ecologically significant regional shifting in emissions is not occurring; the analysis argues against the need for safeguards to control or limit allowance trading.
3. Provide open access and exchange of data between EPA, states, other federal agencies, local government, and the public
Another goal of the Acid Rain Program's GIS development is to encourage open data access: to make GIS and other programmatic data accessible not only internally, but also to the larger EPA and federal communities, states, researchers, and to the general public. The power of GIS lies primarily in the availability of current data from the desktop, and the effectiveness of the system is greatly enhanced when data is accessible to a broad community of users. Connecting users to data is critical to improving communication and productivity, and facilitating integrated program assessment goals. In the immediate term, the Acid Rain Program will assess strategies for data sharing and integration of data systems at the Division level, i.e., using the Local Area Network or other Intranet server; over the long-term, the Acid Rain Program will implement a Web-based application to facilitate open data access on a broader scale.
In the coming year, the Acid Rain Program will concentrate much of its efforts on the goal of integrating all of the program's data systems, and sharing data Division-wide. Currently, EPA maintains separate data systems: the Emissions Tracking System, the Allowance Tracking System, and more recently the NOx Allowance Tracking System, which tracks the NOX allowances held by sources and other organizations participating in the OTC (Ozone Transport Commission) NOX trading program. The primary goal in the coming year is to integrate these data systems with the GIS environmental database, via a network. The ability to easily link the most current emissions and allowance data with spatial environmental data will enable the user to analyze relationships between the different data sets more quickly and effectively.
4. Provide Web-based mapping capability of data and analyses to the public
Providing programmatic data and analyses to the public is another critical component to the success of the Acid Rain Program. The Acid Rain Program will utilize the Internet as the means to achieve broader data sharing with the public.
The Acid Rain Program plans to develop a Web-based application which will serve data (with links to source home pages), analyses, and mapping functionality over the Internet. Distribution of geographic data and analyses will occur in two phases: 1) by providing current data/analysis in ready-made/"canned" map format available for download; and 2) by allowing the user to create maps based on individual research preferences. In the first example, static maps would be available on-line, containing information of interest to a broad audience such as national and regional trends in emissions and deposition, or geographic patterns in allowance trading. In the second example, the user would have the ability to choose a state or region of interest, identify an environmental impact area(s), and specify a time period. They could then search and query that data, displaying results in map format. The user could download the map, which visually displays the query results based on the specific criteria input to the system.
Rudimentary information will soon be available on our website, such as power plant locations and links to other environmental data (www.epa.gov/acidrain). Ideas and suggestions are appreciated (kramer.jennifer@epa.gov).
5. Facilitate informed decision-making affecting environmental management
GIS is a useful analysis tool to assist the Acid Rain Program in assessing the overall impacts of national and regional emission reductions. The power of GIS, as compared to a typical numeric database, is that it visually accounts for the geography of the data, in easily understandable map format. Thus, GIS can help us better understand the spatial relationships between emissions, deposition, and resulting environmental effects. It assists us in identifying regional improvements or local hot spots to determine whether further management steps may be necessary. It enables us to better understand the overall effectiveness of current air pollution control strategies and to facilitate informed decision-making affecting environmental management.
Jennifer Kramer
Environmental Policy Analyst
U.S. Environmental Protection Agency,
Acid Rain Program
401 M St. SW (6204J)
Washington, DC 20460
tel. 202/564-9177
fax. 202/565-2140
kramer.jennifer@epa.gov