
Anchorage, Alaska
Twenty Years Of Esri-Based GIS:
(Are We Smarter Now Than We Were Then?)
By Charles E. Barnwell
GIS Technical Manager, Municipality of Anchorage
It's hard to imagine Alaska being anything but snow and mountains, but the city of Anchorage sits in a spectacular setting. The city is situated in a bowl surrounded by the sea to the west and the mountains to the east. A diverse environment of wooded plains, rolling hills, streams, and wetlands makes up the environment of the city. Anchorage has grown since it's founding in 1915 into Alaska's largest city encompassing a 1,958 square mile area. With a population of more than 254,000 people Anchorage has also grown into a cosmopolitan center of the far north.
Figure 1. An obligue view of downtown Anchorage.
Geographic Information Systems and the Municipality of Anchorage
The Municipality of Anchorage (MOA) has developed a Geographic Information System (GIS) that supports a large number of business functions within its utilities and departments. A GIS is an integrated system of hardware, software, data, and people that allows an organization to layer different types of information, integrate this information, and analyze layers with respect to each other. The GIS software provides many of the tools, but it is also critical to have the right people, collect the appropriate data, and have the support of the organization to make it work. The GIS software we use is Esri, Inc.'s ARC/INFO which provides us with a large variety of functions and abilities. Modernized GIS tools, for example, ArcView and MapObjects, and Internet Map Server, are playing an increasingly important role in Anchorage's GIS.
Environmental information in particular has played a crucial role in Anchorage's GIS development. The map or spatial information regarding various aspects of the environment serves as the fundamental base on which other layers are based to enable GIS to serve the many diverse needs of a city.
GIS has proven to be a powerful tool that is used in both routine and innovative ways to:
The Anchorage community (citizens, schools, neighborhood groups, businesses, non-profits), as well as other local, regional, state, and federal governments, also make direct use of the MOA GIS in the form of frequent requests for products, services and digital data.
GIS Beginnings
The Municipality of Anchorage (MOA) first initiated GIS in 1978 with a study entitled "Anchorage Geographic Information System Study," by Esri, Inc. This was an extensive study analyzing GIS requirements, and included a conceptual design and implementation plan. Many of the findings of this study are still valid even after twenty years, and in fact are still in the process of implementation. The primary goal of GIS then was to make true data integration possible, and analyze data so that better decisions can be made.
The Role of Environmental Data in Developing GIS
In the early 1980's, The MOA paid Esri to prepare integrated terrain unit maps for the entire MOA from which the GIS staff could model the impacts of different kinds of development activity. This also resulted in the printing of a series of coastal management atlases. GIS was originally funded 100 percent by the State of Alaska through the Coastal Management Program. This evolved through the 1980's-1990's such that Planning and then other departments absorbed the cost of the GIS.
The intent of GIS originally was to develop "generalized" maps of the municipal area to use for a planning base; and for the development of a coastal management plan. This included mapping the natural resource base and the parcels at 1:500 scale. The goal wasn't an engineering base at the time. Environmental data was a priority and this data was captured in conjunction with the development of hardcopy coastal atlases. Data such as seismic zones, soils, vegetation, wildlife habitat, was automated and included in the GIS.
System Challenges
The largest challenge at the beginning was first simply getting the software and hardware to work! In 1982, MOA purchased an ARC/INFO license and PRIME computer. These were the days when a computer required to run GIS cost $250,000 and ran at 1/50 the speed of current computers. However, there was a great deal of excitement about GIS and it's potential for local government. The 1980's for MOA's GIS were a time of massive data capture and building a GIS infrastructure.
A dedicated staff was developed in the early to mid-1980's who played a key role in implementing the GIS. Some of these staff have gone on to be leaders in the GIS field. Some of the staff have stayed with the MOA, and have proven very valuable for their knowledge of the municipality as well as for their technical knowledge.
Using Modern GIS Tools
We are engaged in some exciting efforts that reflect the state of GIS today. Traditional ARC/INFO is still very much in use, and tools such as TIN provide great ways to visualize Anchorage's terrain in conjunction with other data layers (Figure 2). The advent of desktop GIS, Web or Internet GIS tools, and GIS tools working with database management software will enable us to achieve our goals on a corporate-wide scale. For example, an application developed using ArcView was developed to enable a senior environmental planner to enter data on his own into a GIS database so that he can visually track wetlands permitting activities utilizing wetlands GIS data (see Figure 5). This sort of application can be developed for other municipal professionals as well, allowing them to make use of the valuable information and analytical tools the municipality has. Internet Map Server (IMS) is playing a very important, and very visible role now for MOA departments allowing access to core GIS data via the intranet, and soon on the MOA's outside Internet web site. Figure 3 below shows an example of the application we will make available on the Internet in July, 1999.
Figure 2. An aerial view of downtown Anchorage produced using GIS software. GIS layers and aerial photography can be draped on a 3D base to give a better feel for the actual terrain.
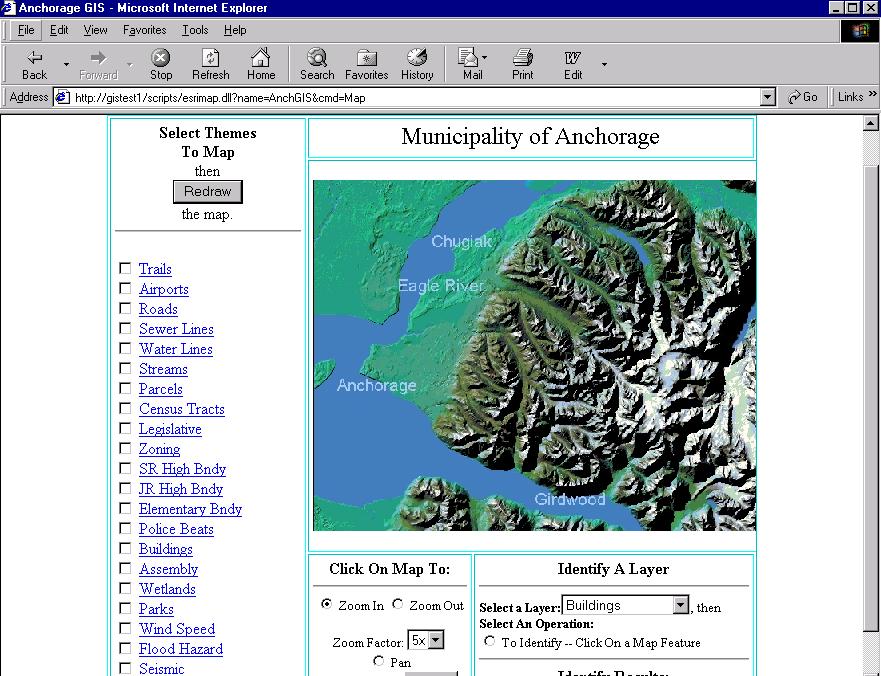
Figure 3. Internet Map Server application (MapObjects) providing access to MOA core GIS data.
Organizational Challenges
A corporate or centralized GIS group was established in 1997 by the MOA Executive Manager to pool the various MOA GIS efforts; and to provide services to the municipal enterprise, efficiently coordinate common GIS tasks, and manage "corporate" municipal data.. A corporate group was needed in order to reduce the duplicative GIS efforts in many departments, and to achieve the goal of citywide data integration. A GIS Steering Committee, composed of department directors, oversees resource allocation from departments, GIS data policies, and determine directions that municipal GIS needs to proceed in. A Technical Advisory Committee performs a similar role on the technical side, evaluating technical needs, determining technical directions the municipality should proceed on, and how to best allocate departmental GIS expertise to enterprise wide projects.
Partnerships
Implementing a GIS on a truly working basis requires municipal departments working in concert to develop databases and efficiently use each other's resources for the good of the whole. It also requires partnering with other agencies wherever possible to obtain funding, share data, and knowledge. To achieve a common GIS database, we are currently engaged in a project headquartered at the corporate group to create a "framework" corporate database that can be utilized by the whole enterprise. We have entered into a partnership program partly funded by the US Geological Survey's Federal Government Data Committee (FGDC) Clearinghouse program and Anchorage Water Wastewater Utility. The program is designed to establish a "clearinghouse" where municipal and other related data about the Anchorage area can be made available to the public. The clearinghouse will house the data framework, and generally assist in making the data transparently accessible as is possible using new technologies on the municipal intranet. Internet (Web)-based technologies will make GIS and related data accessible not only to the municipal enterprise, but to the public.
Environmental Data Plays a Key Role
Environmental data plays an important part in managing the health and safety of Anchorage's people, and in ensuring the environmental character is not harmed. GIS has always been an important tool in managing and analyzing environmental data, and with Anchorage's strong GIS programs, we have used it in important ways. As discussed previously, the Coastal Atlas was developed in 1985 to depict anchorage's coastal data including seismic zones, soils, vegetation, topography, wildlife, and other data. Most of this data has been managed by the municipal Planning department. Engineering type data, for example street maintenance data, is captured and managed by the municipal Public Works department.
The environmental data is important in terms of real business needs. The municipal Assessor's office needs accurate mapping of streams, coastline, and wetlands to use in making accurate determinations of property value. The fire department needs accurate mapping of roads and trails, and vegetation for wildland fire management. The emergency management office needs an accurate seismic mapping coverage to determine where earthquake damage might have been most severe in the event of an earthquake.
Seismic Zones and Earthquake Assessment
Anchorage is situated in one of North America's most active seismic areas. The 1964 Great Alaska Earthquake is considered the strongest North America earthquake in recorded history with a magnitude of 9.0. Consequently, mapping and inclusion of seismic zones by multiple agencies such as the USGS, State of Alaska geological survey, has been incorporated into a municipal GIS layer, and will be continually be updated. This data will eventually be made available on the Internet in an application for public access. Currently the corporate GIS group is working closely with the Emergency Operations Center to develop MapObjects and ArcView applications for rapid access and analysis of GIS data relevant to emergency situations including earthquakes.
Figure 4. Scene of devastated part of downtown Anchorage in the 1964 earthquake (source: USGS).
Watersheds
Anchorage is a natural bowl similar in form to Los Angeles, which contains a number of important watersheds crucial to the environmental health of the area. The municipality began a watershed management program with the goal of building an environmental database. The Watershed Management Section (WMS) of the Department of Public Works' Project Management & Engineering Division is developing and administering a projects and information database. This database (informally called the Municipal Water Resources Infobase) has been under development for the last several years. The database will support watershed management and water resources-related activities required under the Municipality’s NPDES permit to discharge storm water. It also will meet water resources related information needs of drainage and land development planners and designers. Core database elements include tabular data, spatial coverages and user applications reflecting water resources-related information needs. The database will be accessible to a wide range of users. Some functions of the program are watershed characterization, watershed mapping, creating a Receiving Water Quality Water Resources Library, and establish and publish preliminary mapping standards descriptions. The municipal GIS watershed program will result in layers or coverages depicting the following environmental types:
Ocean
Watersheds
Streams (especially stream attributes)
Stream reaches
Lakes
Wetlands
Floodzones
Elevation Contours
Outfall Basins
Storm Drains
Outfalls
Wetlands
Wetlands are a very important element in Anchorage's environmental database. Wetlands, as elsewhere in the nation, contain high concentrations of wildlife, and act as important repositories for groundwater. Since 1989 the municipality has maintained a GIS coverage depicting the various wetland classes and categories in Anchorage, and has used this data along with orthophotography and other GIS data to manage wetland health and monitor impacts to this very important resource. The main challenge is to make GIS easy to use and useful for planners as a tool for tracking and monitoring development of wetlands. Typically these planners are those who have busy schedules dealing with the public, managing daily wetlands issues, and when possible making sense of real data to formulate policy.
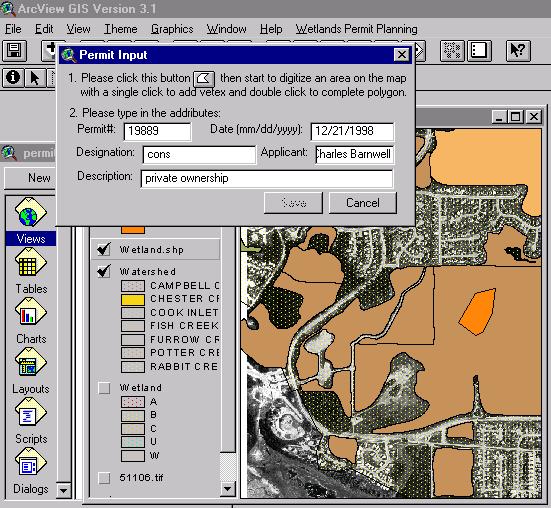
Figure 5. ArcView application for wetlands and watersheds management in the Anchorage city area.
Challenges
The next challenge which still faces us in the GIS front is accomplishing true data integration. Local governments are unique in that they contain a rich assemblage of data that is vertically deep. The challenge is to make this data usable by the many departments comprising a municipality. There are many data layers posessed in a typical city, which ideally should be integrated in order to truly make GIS useful for the whole enterprise. Anchorage is a good example with over 100 data layers collected since 1983.
The potential is enormous for serving all departments with useful information. For example, platting and zoning functions need updated and accurate wetlands data to assist them in their activities. The key initiatives and technologies that we see is critical to our effort are the FGDC clearinghouse initiative which we are a participant in; new technologies that allow better database integration; and the Internet. Relational database software with a spatial component will help us establish an open standards-based framework that enables full data integration across multiple departments. Once we can achieve this, we can then serve the many demands for GIS that departments have.
The largest challenge remains to integrate the many vertical types of data so that there is a "common ground" to work on. Despite developing an environmental database years ago, this remains as a task to be fully completed. In the next year we will be engaged in determining what tools are most appropriate for common use; what database designs are most useful for all departments to make use of; and how can we best get this GIS data out to our customers which include the muncipality itself and the public at large. In this fashion, we hopefully close the loop on one of the original goals laid out in 1978---an integrated GIS database that provides a common ground for potentially all municipal departments to base decisions on.