The evolution of GIS applications at the Berchtesgaden National Park from 1982 till today
Werner d'Oleire-Oltmannns
Abstract
The GIS was created to be used as a general storage tool for most different activities. It started within the MAB (Man and Biosphere) programme. The project was desinged together with Esri-Germany. The beginning of the application of ARC/INFO was science. This basic GIS evolved in adding a monitoring tool. Then GIS based habitat models came up. These models expand in complexity and also jumps in scale are incorporated. All informations are used for a GIS based master plan and for a traffic and leisure management.
Introduction and study area
The tension between Man and Biosphere is certainly one of the most striking situations existing on Earth. Especially the different aspects if one is looking to a system from the point of view of research, natur protection, sustainable development or business. This variety directed from ecological-natural science view in contrast to a more socio-political viewpoint shows the most highly importance of an approach which tends to bring together at least a part of this broad approaches.
For such an integrated approach it had been necessary to establish ecosystem research developed from ecology as a new science. This appeared in the last decades to a great deal. When UNESCO implemented the "International Biological Programm" (IBP) around the world a lot of most existing research in ecology started, many new methods where developed and brought to the field. But two major problems occured within the IBP. On the one hand methods for integrated reflection on the data were more or less missing on the other hand the design of the research came from ecology. This means that a set of parameters was selected after the state of the art and so important factors like human influence and others often were missing. The approach of selecting a certain box out of the system creates the problems during interpretation of results. The follow up program of UNESCO consequently was the "Man and the Biosphere" (MAB) programm. MAB tried to integrate also the direct and indirect human influence into the ecosystem theory as a factor of the system itself. This should open the possibility to reflect on the results from different viewpoints.
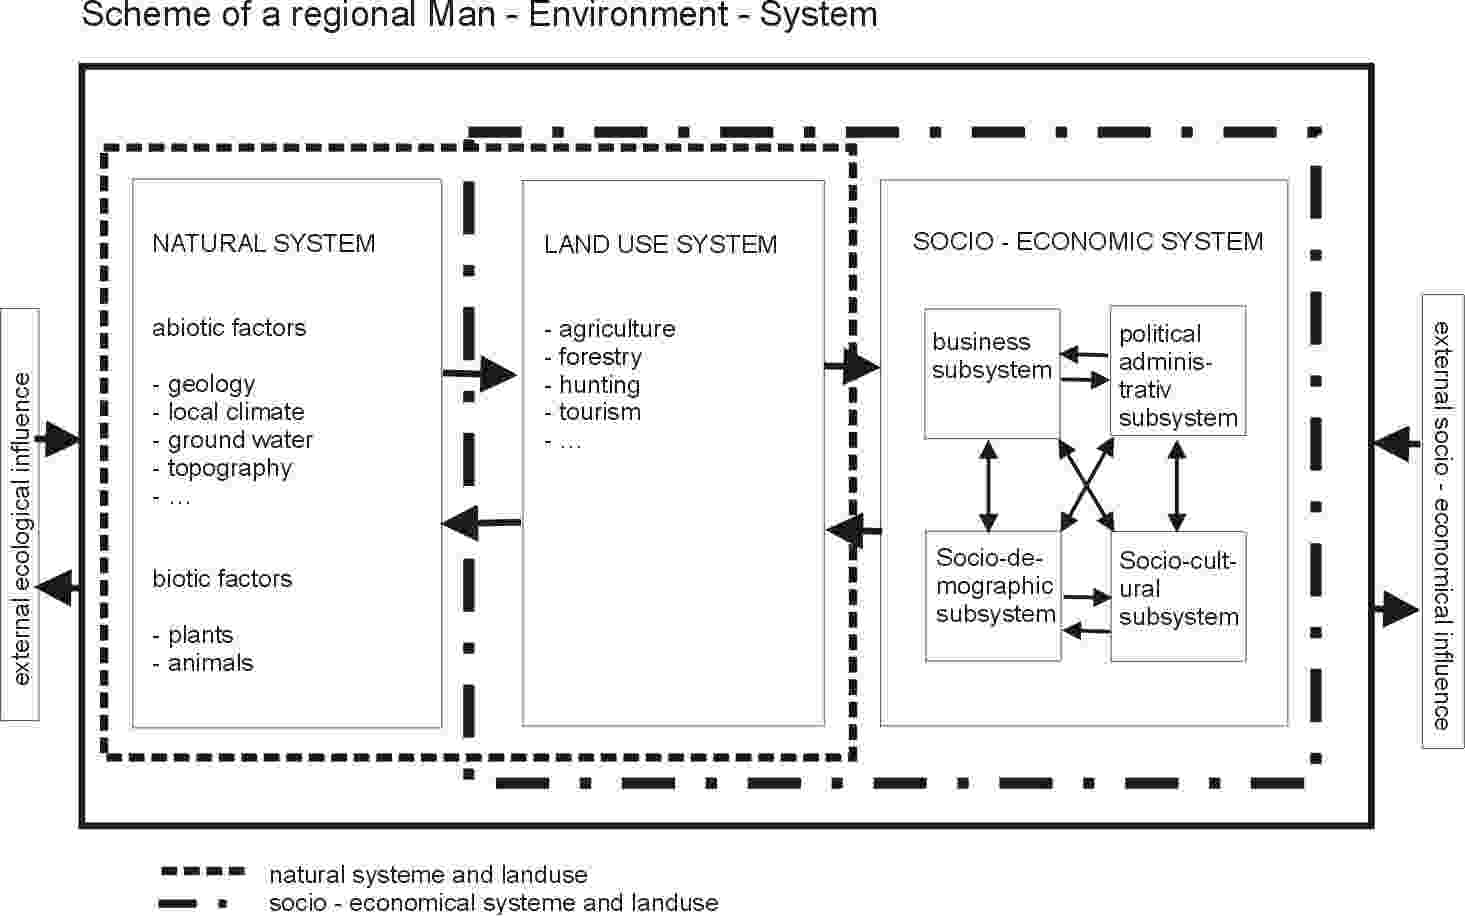
Regarding this background the components of an ecological and economical system have to be isolated. During the Swiss MAB contribution Messerli et al. (1979) created a scheme for a regional Man-Environment System (Fig:1).
Fig.: 1: Scheme of a regional Man-Environment-System after Messerl et al. 1979 changed
This scheme became the basic theoretical layer for the work within the project " Applied ecosystem research Berchtesgaden". This project tried to develop methods which on the one hand are valid for integrated research and on the other hand can be also used to take action f.i. in a planning process. The three components of the concept are the biotic and abiotic parts of the system, the landuse and the socio-economic part. The subsystem landuse comprises all human activities in nature. This is agriculture as well as forestry, hunting, tourism and also the influences of the industrial-urban ecosystem. The socio-economic part contains as a central factor the economy, but socio-demographic factors as well as the political administrative and cultural components of human live. Because a regional men-environment-system is selected as a part from the earth and therefore it is not closed, we have external factors influencing the system from both direction, the human and the natural one. Those could be the overall global warming or decisions taken at the EU level like the Agenda 2000.
But all factors are at the end part of one ecological system. Only from the point of view of natural sciences it seems extraordinary to include social-sciences and vice versa into the system, not from the system itself. To process all the different aspects of the system in different directions and on different hierachical layers most different methods need to be used. Therefore it is necessary to leave the known parts of once "home" science, to be carefull in using terms without telling the others the meaning, to forget to speak about the theoretical background of the hypothesis and to fomulate together basic values. This small amount of differences to once safe sciences shows the chances and the potential of conflicts which are in such an approach. One has to start a new thinking.
The area of the MAB6-Project
When looking to the regional system from a historical view huge changes occured since man established himself in the Berchtesgaden area. The area is 46,000 ha. The landcover is about 50% woods and forests, some 30% are alpine pastures, rocks and other landcover types outside the forest. Only 2 to 5 % of the total area is used for agriculture and settlement. About 25,000 people live permanent in the area. Every year about 2.5 million overnights from tourists are registered. Because of a mean less than ten overnights per tourist this means that some 300,000 people at least for a short time in this system. In addition about one million tourists per year are calculated to appear only one day in the system. Tourism is the central business factor in the region.
Due to the climatic and soil conditions agriculture mainly consists of cattle breeding and milk production. Most farms are since a very long time used as part-time-farms. The men go to work. In former times the women did the daily work on the farm. Nowadays the farms also have bed and breakfast rooms. Because of the difficult situation of agriculture and the poor soils a loss in farms is a permanent process. Within the system the production of local food is only important for some specialised products. Most of the necessary food is imported to the system.
The tourism gives work for a lot of people in the service sector. Trade and industrial production which is not directly or indirectly depending on tourism is week developed. This is also due to the remote situation of the area and the long distances to commercial centers.
Woods and forests have been used intensively in history. The actual wood market and the restrictions from the forest law gives the forests a time of regeneration. In addition there are intensive efforts to enlarge the biodiversity of forest plants. To get the result in view different aspects like reducing ungulates (wild and domestic) in the forests are undertaken.
About half of the area today is national park. The nothern limestone alps have a high variety in geomorphology. This creates a lot of habitats and a relativly high biodiversity for the nothern slope of the Alps
Methods
There was a long discussion of methods to be used in the MAB6 project (Kerner et al. 1991) Only some very general decissions were taken.
A general question for the research project MAB6 "Applied ecosystem research Berchtesgaden" was placed. The general question for all participants of the project was: "how does the actual landcover influence the subject under research (water, animals, socio-economy...). A general set of tools was used for the ecosystem questions. This was very important for the project because from the very beginning a harmonisation of the core dataset was defined. This gave at the end of the project the chance to do integrated evaluations and to have a common databasis which was then also used for the development of the new master plan for the area. The combination of a geographic information system (GIS) and databanks was the result. The beginning of the development of the Berchtesgaden GIS started in the early eighties. Today differentiated information is available (Ashdown &.Schaller 1990).
Depending on the existing data the scale of the Berchtesgaden GIS is 1:10 000. This is a scale which already gives rather differentiated results. And for an area of 46 000 ha the amount of data
is already high. The altitude has a range from 450 m above sea-level to 2714 m. This means that the topography is very dynamic. The contour lines were digitized in 100 m steps. From contour lines the slope (in 7 classes) and the aspect (in 16 sectors) have been detected by hand. The overlay of those three basic layers together with the landcovertype mentioned below needed to be done by hand because of soft- and hardware limitations. So we got a cover witch consisted of some 120.000 polygons called the "smallest common geometry" (SCG). These polygons have been digitized and the data added to each polygon.
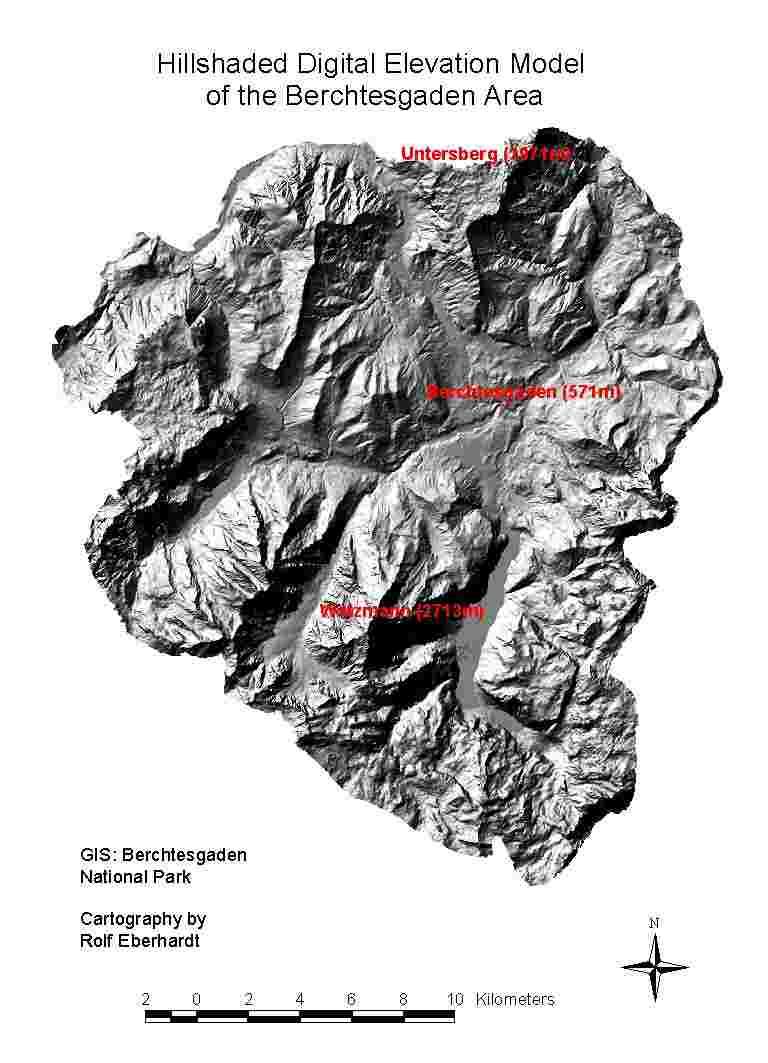
Fig. 2 Today a DEM of a much higher resolution is available.
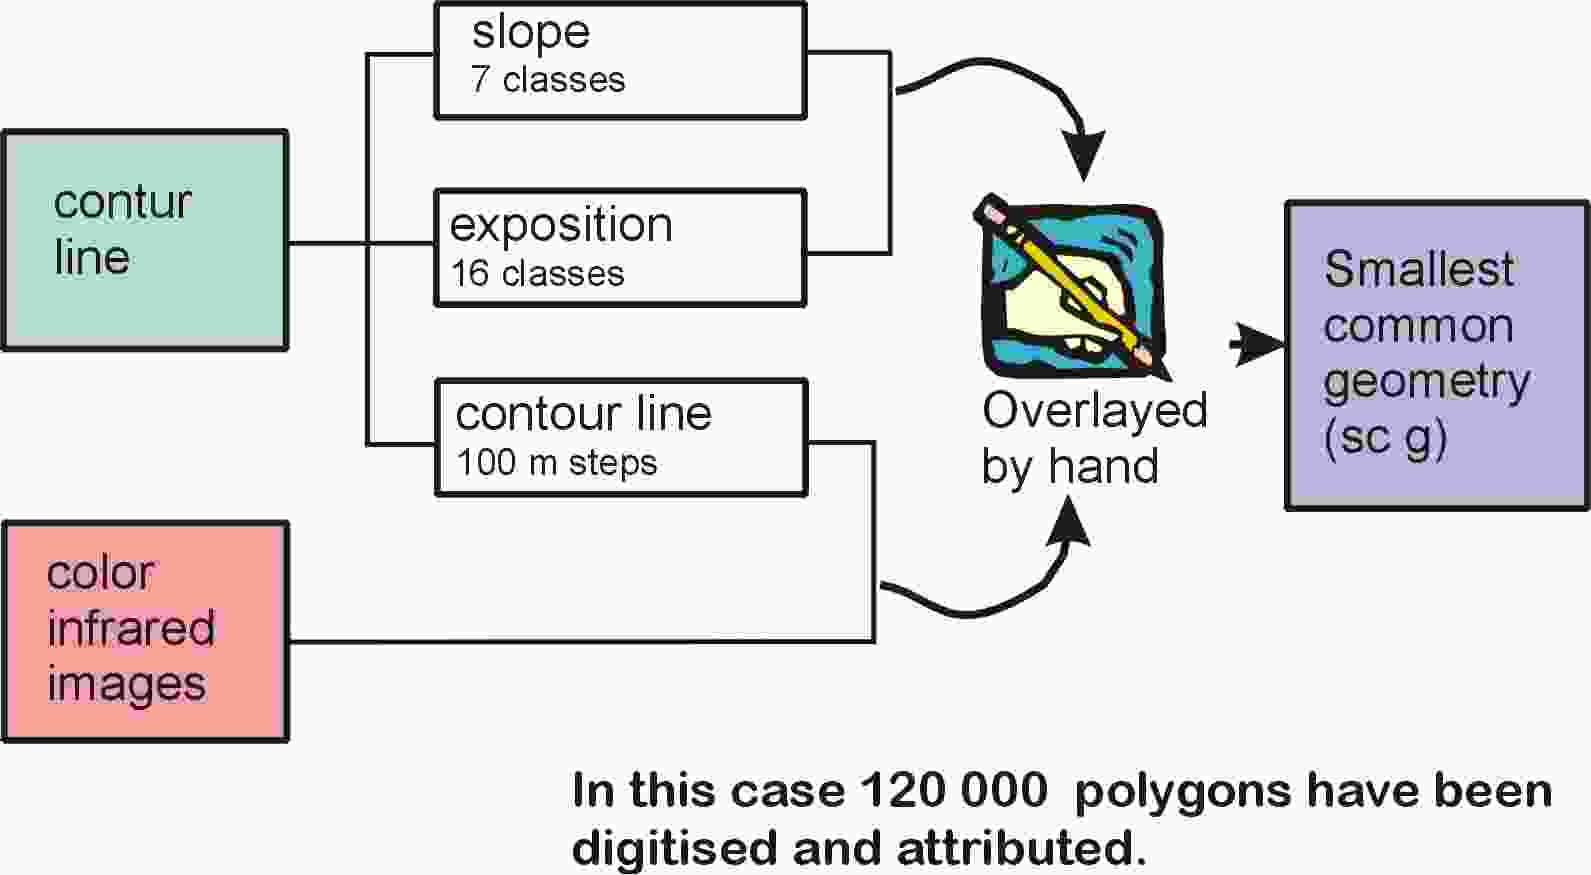
Fig. 3 The method of creating the smallest common geometry in the MAB6 project
The most important question was how to get a usefull landcover information about all ecosystems and for the whole area in a reasonable time and not to expensive. After a long discussion with the different users landcover- or "ecosystemtypes" have been used. The information comes from color infrared imagery (CIR). This gives a consistent information about the whole area at a certain moment.
A hierachical system to define the landcover types is used comparable to the CORINE landcover type but in more details. Depending on the additional available information the differentiation of types could be deeper. For certain areas like the grassland a vegetationmap was existing, therefore additional types could be entered into the system. On the other hand results could be aggregated into groups of special interest. The most important reason for the selection of the landcover types was the useability for different scientific groups. Most maps can hardly be used by other scientists because they do not map the whole area or use keys for specific scientifique questions. But the need to get information about a parking, a rock area or a forest as well as about a settlement, an open vegetation or the shape of a lake was the task.
The use of landcover- or ecosystemtypes is always a certain point of critic. This is clear, because you have to define your types knowing that in nature all is going along a gradient. The defining of the type is therefore a decision which always can be discussed. It is necessary to keep this in mind because all selection done with a GIS incorporates this problem.
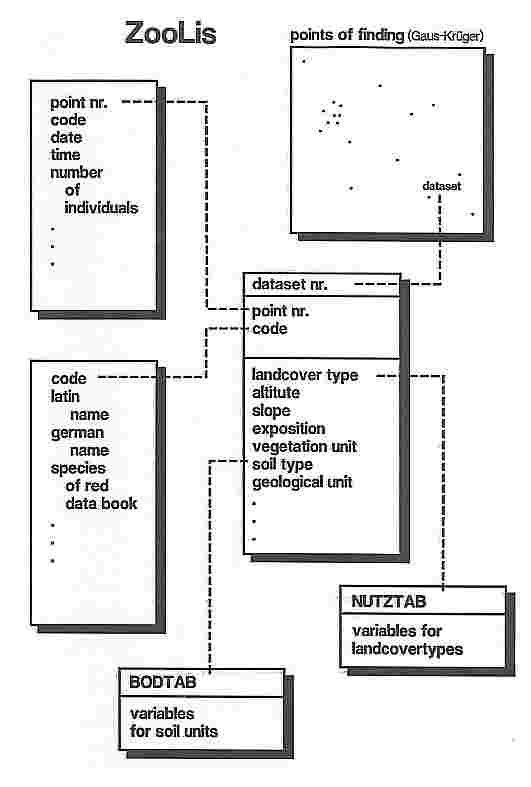
Fig. 4 The data bank design for zoological point data
The combination of topography and landcovertype is the basis of the Berchtesgaden GIS. In addition a variety of maps could be added. Most of them like the soil map, the vegetation map or the map of water sanctuaries and others do not cover the entire area. For specific questions they can be used as additional information for the interpretation of some results.
Beside the polygons layers of line covers exist. The two most important are the river- and the road-system. And there is a big group of point data in the system showing for example all points of climatological or zoological findings.
As shown there is only one GIS for managers, scientists and for monitoring. We do not think that it can be of any use if the system is devided. Certainly layers can exist which have a specific scientific background and may not be used for general purposes. But managing should mean to use all sorts of ecological information which has been collected in research and therefore the link must be there.
The application of a GIS also is a fundamental tool for the monitoring of your area under concern. In Berchtesgaden the CIR arial views will be redone within ten years. By this the development of the area in time can be shown. But it is necessary to underline that a GIS and the databank must carefully be handeled. The documentation of data for users in a later time is a very important and time consuming work. But otherwise the system becomes useless. Probably this is one big reason to use GIS in parks because there the area is more or less constant and an administration is available to certify this really important work. For more information look into the data documentation under www.nationalpark-berchtesgaden.de and go to "Das Infosystem".
The different data banks which could be developed followed the same scheme as the research questions shown before. Depending on the necessity of the sectoral science the databank was implemented. Only one commen rule was of importance. The data bank has to be created as one, which is usefull for research as well as for monitoring. This means especially that the data bank itself must be selfexplaining, so it is also the tool for data documentation.
A last point needs to be mentioned under methods. It is the approach to assemble data from very different researchers. At the beginning of each research a harmonisation of the findings has to be dicussed. During a research the data will not be incorporated into the central data pool until the results are published.
Some results from zoology
Due to the fact that only some results can be presented, the evolution of the GIS-application should be shown with some examples from the zoological research. Zoological findings are always points like a trap, a seen animal, an earth burrow or something else (d’Oleire-Oltmanns & Franz 1991). These data can be overlayed with further informations of the GIS. Selections can be made after time, sex, hour... and afterwards analyzed. The results will be treated with the tools of statistic or other methods. If you try to answer the question "how does the actual landcover influence the distribution of an animal species", these data already give you a first result about the use of the area of a animal species during time and space (d'OLEIRE-OLTMANNS, W. 1991, d'OLEIRE-OLTMANNS, W. & H.P.FRANZ, A.SCHUSTER 1991).The GIS after these steps can be used as a tool to create distribution maps of potential occurence of species. Up to now it has been done for about sixty vertebrate species in different approaches (BERBERICH, W. 1992, BÖGEL, R. 1996, EBERHARDT, R. 1996, FRÜHWALD, B. 1997, NPV (Nationalparkverwaltung Berchtesgaden) (Ed.) 1994, PECHACEK, P. 1995).
A singing bird needs another treatment as a chamois or the golden eagle.
All distribution maps will be more or less complex models. The potential breeding distribution for singing birds is shown for the black redstart (Phoenicurus ochruros). The species occurs in the region in two main habitats. The rock areas above timberline and the scattered settlements (artificial rocks) in the valley (Schuster 1996). The model is relatively simple, it follows the idea "where did we see the animal and what are the known ecological attributes which are necessary". This is already the model in mind. The result are distinct polygons which show the potential distribution after a chosen classification. So it was prooved that the approach is valid from the methodological point of view. Within the singing bird project data were collected until the changes of statistical analysis and the chosen method came to saturation. One most important result was, that the shape of distribution models in most cases was stable but the quality of the usable habitat segments changed.
The problem of distinct polygons was still there, wheras ecosystems often know gradients. In an used habitat there are aras wich are not valid for another use than to cross it for reaching annother good area.
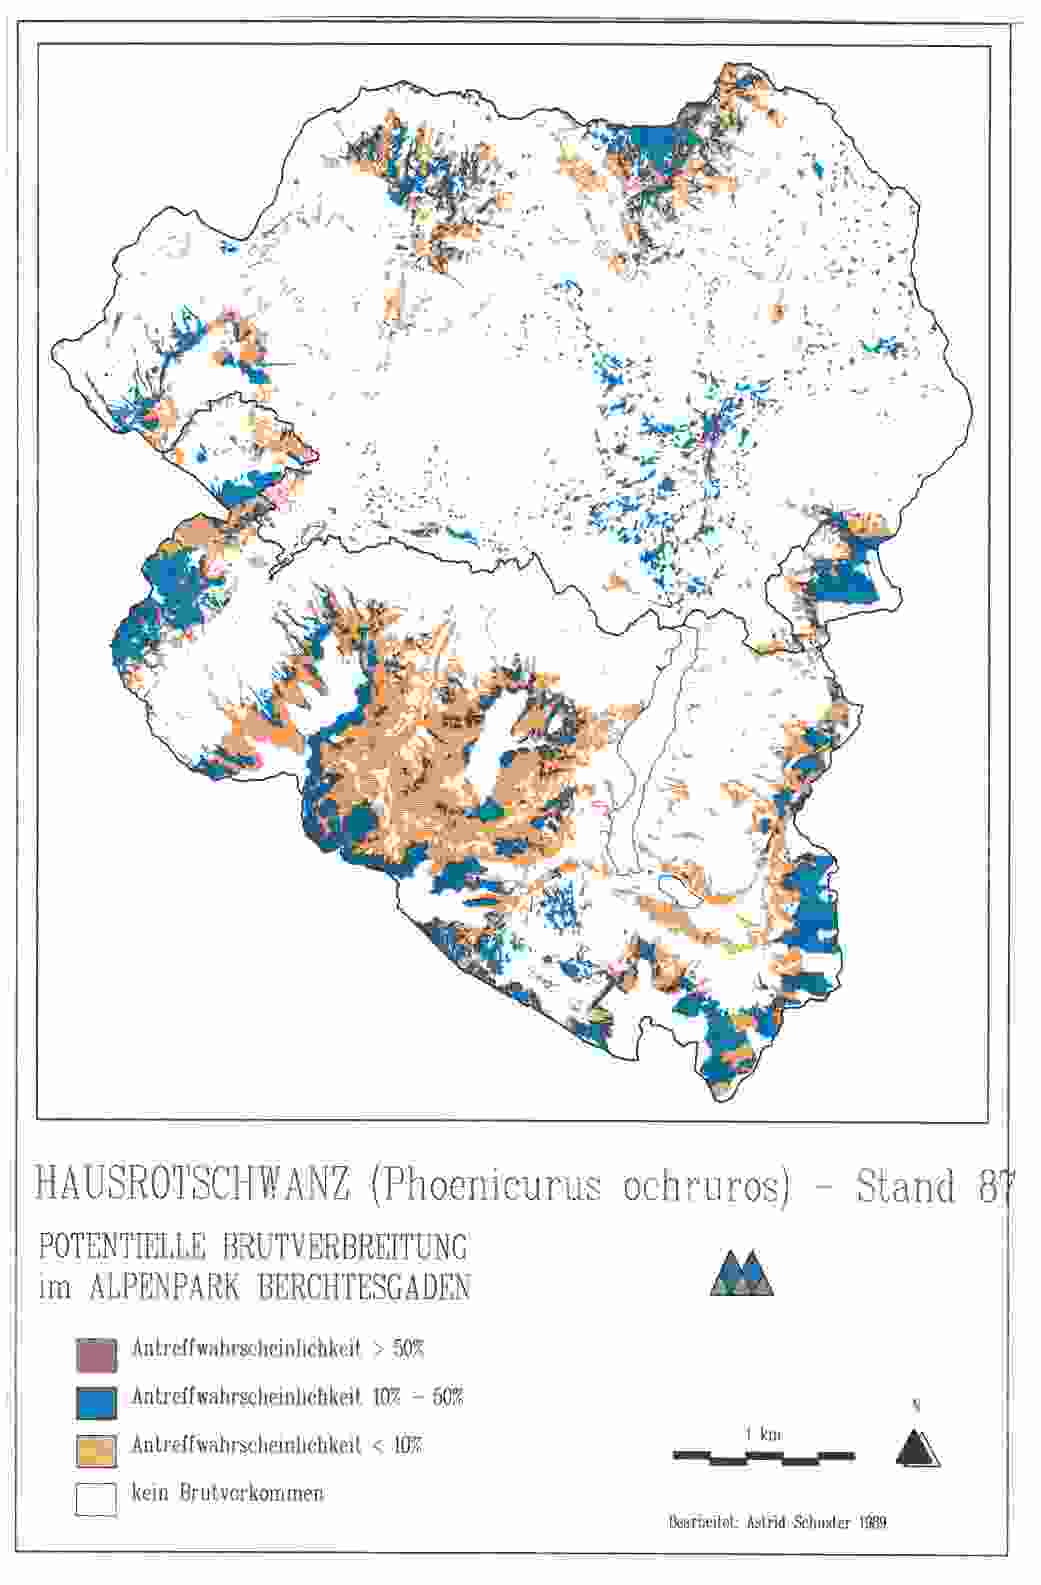
Fig. 5 Breeding habitat of the black redstart model 1987 differentiated by the probabilities of finding for the species (Schuster 1996)
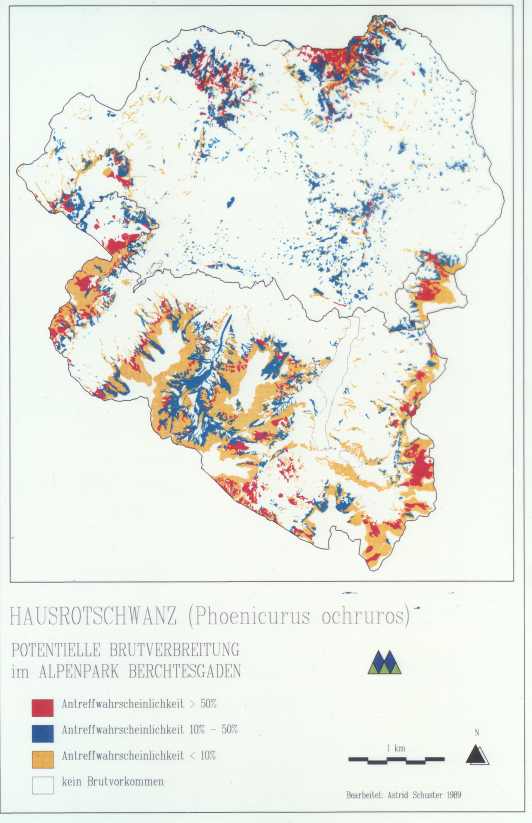
Fig. 6 Breeding habitat of the black redstart model stabilized differentiated by the probabilities of finding for the species (Schuster 1996)
One important help of this application, if you work on the landscape scale, is the possibility to get also first information about areas where you could not work, because they may not be accessible which is nearly one third of the area. With test plots you need to confirm your model. It is an iterative approach. The model will be redone several times until a valid and stable model can be confirmed.
Most different management task occured when the first distribution models were valid. For understanding the ecological history of the data of the formeer altitudenal distribution of trees were used to describe the probal landcover before human settlement (d’Oleire-Oltmanns, W. 1991). Another task was to show where helicopters will influence species which are sensitive against disturbance. A set of species were selected. The most striking question was how to show the nesting sites of raptors using a simple AML. Eagles and other raptors use small cliffs for nesting in the forset belt. The scale of the coverages could not represent this. The most simple AML was the selection of all polygons under 1500m osl and of the steepest slops.
The result was striking and valid to reality (Fig. 7). This result together with others was an argument which was accepted by those which should adapt their flight activities to the desires of nature protection for the first time.
Fig. 7 The usable cliff valid as nestsides for raptors
In the evolution in using the GIS more differentiated models could be made. As a substantial delimination the distict borders of the polygons remained. The high power of the evolving hardware the GRID in ARC/INFO and the kernel-estimation (BÖGEL 1996) were of high importance. The first time it became usefull to break up the solid borders of the polygons.
With the fundamental data as there are the digital terrain model (DTM) and the landcover a set of descriptions of abiotic factors can be made on a relative scale. Models were created for the relative insulation, the thermal activity including the albedo of the landcovertype (BÖGEL, R. & R. EBERHARDT, 1997, EBERHARDT, R., R. BÖGEL, B. FRÜHWALD, A. LOTZ 1997) for the snow distribution due to aspect, the occurence of winds and others. These basic models combined with habitat quality for an animal and animal data can be combined to complex models showing centers of habitat quality as demonstrated for the chamois (LOTZ,1997).
The approach of definig fuzzy models seems to be a very important step towards questions about the probability of areas for species and the importance of human influence. It also reflects on the fact that we never know all the factors which influence the distribution. Our models are always models and therefore poor compared with nature. With this relative approach also in building and testing the model one can learn about the dominance of certain factors for the species. Therefore EBERHARDT et. al. (1997) has developed the Kernel-HSI (Habitat Suitability Index) which evaluates the density of habiatat suitability by neighborhood relations.
Now differentiated fuzzy models can be built. Using this approach changes the view from looking to an animals biotop to regarding the habitat from the point of view of the animal. More general does this mean that the use of an fuzzy approach changes the view of an object to view from the perspective of an object. This will be shown by the capercaillie habitat suitability model (EBERHARDT 1999). A set of single models, all fuzzy ones, were developed. For the habitat suitabiliy model, models of the functors "suitability of the landcover type", the "net of suitable landcovertype within a defined sourrounding", the "diversity of suitable landcovertypes in a defined surrounding", the "suitable range of altitude for the capercailly in the area", "the suitable slope", the "favorable thermal conditions", the "snow cover" and "low human disturbance" were constructed. They come into general pool and with an iterative approach those eight factors where recombined several times until the most appropriate combination was found which shows discrete borders of more or less favourable actual habitats.
In an additional step using the kernel HSI approach the hot spots of good capercailly habitat clearly can be shown (Fig. 8).
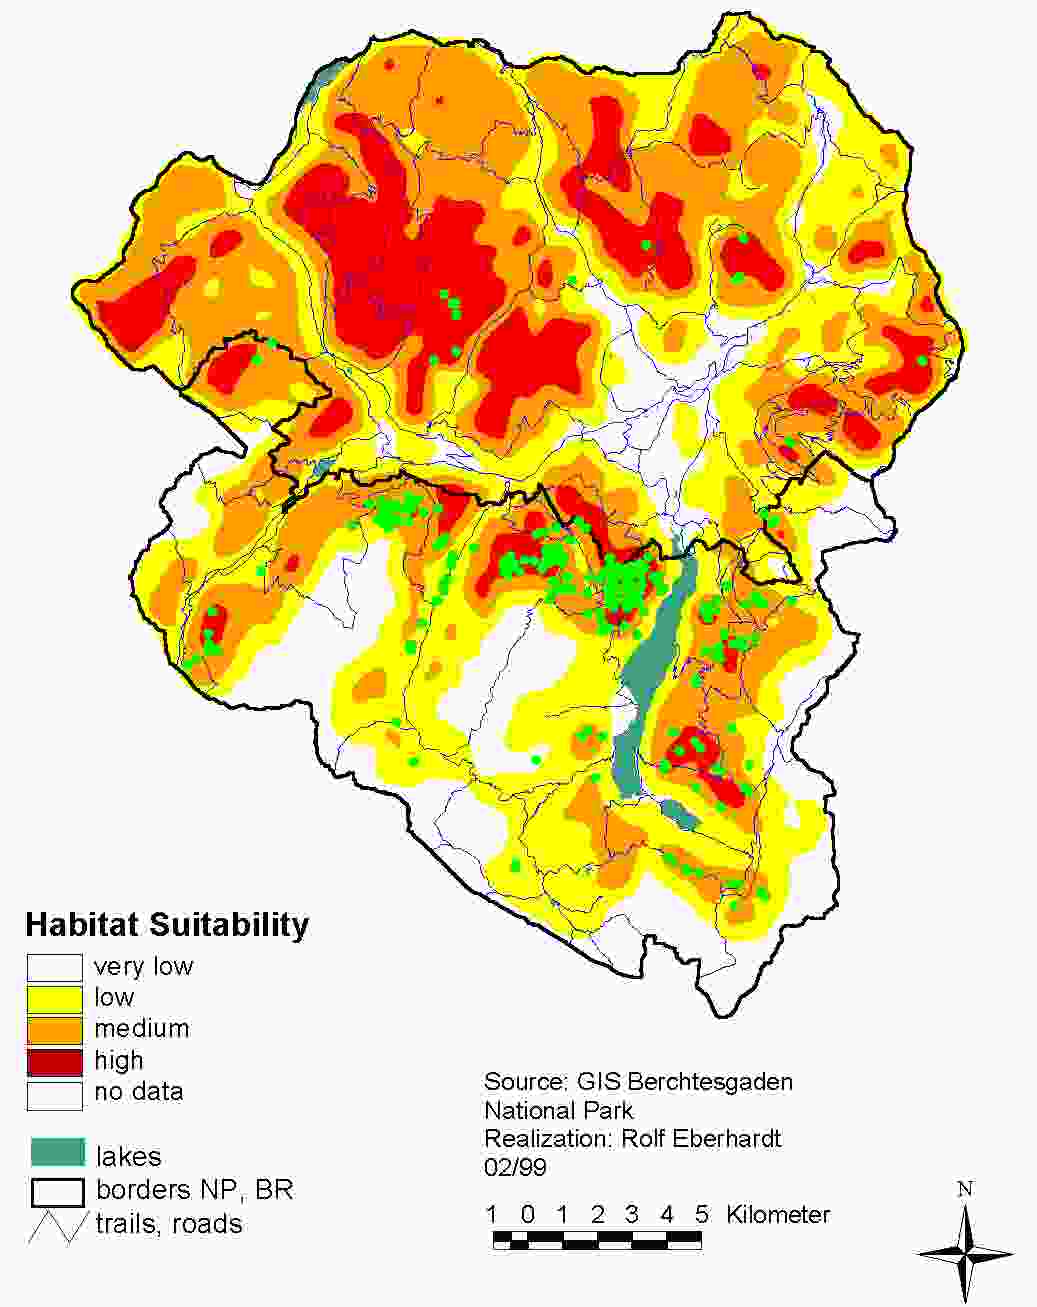
Fig.: 8 Habitat suitabiliy model for the capercailly – continuous valuation
Literature
ASHDOWN,M. & SCHALLER,J 1990: Geographic information systems and their application in MAB-projects, ecosystem research and environmental monitoring. MAB – Mitteilungen 34, 1 – 250.
BERBERICH, W. 1992: Das Raum-Zeit-System des Rotfuchses. Untersuchungen der Lebensraumansprüche und der Aktivitätsrhythmik des Rotfuchses (Vulpes vulpes) im Alpenpark Berchtesgaden. Nationalparkverwaltung Berchtesgaden, Forschungsbericht 17/1989, 2. Aufl.: 71pp.
BÖGEL, R. 1996: Untersuchungen zur Flugbiologie und Habitatnutzung von Gänsegeiern (Gyps fulvus HABLITZL 1783) unter Verwendung telemetrischer Meßverfahren. Nationalparkverwaltung Berchtesgaden, Forschungsbericht 33/1996: 168pp.
BÖGEL, R. & R. EBERHARDT 1997: Modelle zur Bewertung von Thermik und dynamischen Hindernisaufwinden zur Beurteilung der Flugbedingungen für Großvögel. In: Angewandte Geographische Informationsverarbeitung IX. Salzb. Geogr. Mat., 26: 23 - 33.
EBERHARDT, R. 1996: Raumnutzung des Steinadlers Aquila chrysaetos (L.) im Biosphärenreservat Berchtesgaden. Dipl. Arb. Univ. Saarbrücken: 113pp.
EBERHARDT, R., R. BÖGEL, B. FRÜHWALD, A. LOTZ 1997: Modellbildung zur Raum- und Habitatnutzung terrestrischer Organismen am Beispiel von Steinadler und Gemse. In: Angewandte Geographische Informationsverarbeitung IX. Salzb. Geogr. Mat., 26: 47 - 58.
EBERHARDT, R. 1999: GIS-gestütztes Habitateignungsmodell für das Auerhuhn (Tetrao urogallus) im Biosphärenreservat Berchtesgaden 21S. (internal paper)
FRÜHWALD, B. 1997: Habitatnutzung der Gemse (Rupicapra rupicapra L. 1758) im Nationalpark Berchtesgaden. Dipl. Arb. Univ. Bayreuth: 95pp.
KERNER,H.F., SPANDAU, L.,KÖPPEL, J.G. 1991: Methoden zur angewandten Ökosystemforschung entwickelt im MAB - Projekt 6 "Ökosystemforschung Berchtesgaden". MAB – Mitteilungen 35.1 und 35.2
LOTZ, A. 1997: Habitatnutzung der Gams Rupicapra rupicapra (L.) im Biosphärenreservat Berchtesgaden. Eine GIS-gestützte Modellbildung auf Basis telemetrisch erhobener Daten. Unveröff. Dipl.arb. Inst. f. Biogeogr. Univ. Saarbrücken: 120pp.
MESSERLI, B. & P. MESSERLI 1979: Wirtschaftliche Entwicklung und ökologische Belastbarkeit in Berggebieten. In: Fachbeiträge zur schweiz. MAB – Information, Nr. 1, 20S.
NPV (Nationalparkverwaltung Berchtesgaden) (Ed.) 1994: Zur Situation des Schalenwildes im Nationalpark Berchtesgaden. Forschungsbericht 28/1994: 110pp.
d'OLEIRE-OLTMANNS, W. & H.P.FRANZ, 1991:Das zoologische Informationssystem ZooLis) der Nationalparkverwaltung Berchtesgaden. Verhandlungen der Gesellschaft für Ökologie (Freising-Weihenstephan1990) Band 20, 685-692
d’OLEIRE-OLTMANNS, W. 1991: The interaction of land cover type and animal distribution: an evolution in time and space. In: Proceedings Resource Technology 1990, Second International Symposium on Advanced Technology in Natural Management, November 12-15, 1990, Washington D.C., USA
d’OLEIRE-OLTMANNS, W. & H.P. FRANZ, A. SCHUSTER 1991: Die Anwendung der Ökosystemforschung für die Analyse der räumlichen Habitatverteilung von Tierarten. In: Riewenhern,S. & H. Lieth Verhandlungen der bGesellschaft für Ökologie (Osnarück 1989) Band XIX/III, 619 - 627
PECHACEK, P. 1995: Spechte (Picidae) im Nationalpark Berchtesgaden. Habitatwahl, Nahrungsökologie, Populationsdichte. Nationalpark Berchtesgaden, Forschungsericht 31/1995: 181pp.
SCHUSTER, A. 1996: Singvögel im Biosphärenreservat Berchtesgaden. Vogelbestandsaufnahmen und ihre Umsetzung zu Verbreitungskarten mit Hilfe eines Geographischen Informationssystems. Nationalparkverwaltung Berchtesgaden, Forschungsbericht 34/1996: 116pp.