SAP Business Data Visualization with MapObjects
GIS technology provides new ways to see and understand complex business data.
We will demonstrate using MapObjects to display data from the SAP Business
Information Warehouse, using Microsoft's OLE DB for OLAP interface. We will show
ways to combine MapObjects displays with other visualization tools as we analyze
corporate sales and marketing data.
Copyright © 1999 SAP Labs, Inc. All rights reserved.
Overview
- GIS and the SAP Business Information Warehouse
- Overview of the SAP BW 2.0 plans
- Geographic data storage
- Geographic data presentation
- Research design prototypes
- Animation over time
- Alternative MapObjects renderers
- Combinations with other visualization tools
- "Rolling your own" today
SAP Business Information Warehouse
- SAP BW provides an end-to-end data warehousing and online analytical
processing solution
- Business Explorer 1.2 provides an Excel user interface for data analysis
and reporting
- Analysis and reporting an obvious first application for GIS
- GIS to be integrated into BW 2.0, using MapObjects and ArcView
- Simultaneously working on GIS architectural issues throughout the SAP
product line
Geographic Data Storage
- Geographic data stored in the SAP BW
- Geographic hierarchies available as external hierarchies, e.g.
- Business Explorer know what dimensions contain geographic data
- Worldwide geocoding issues -- postal code level?
- ArcView provided for geographic data editing
Geographic Data Presentation
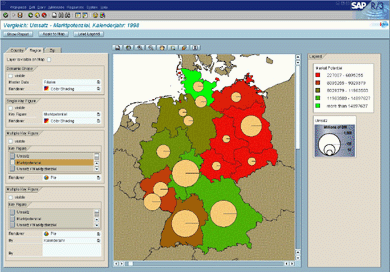
- MapObjects 2.0 embedded into SAP Business Explorer
- Map control appears on an Excel worksheet
- Business Explorer lets report designers and analysis specify relationships
between BW measures, BW dimensions, and MapObjects map layers
- For example:
- Let me see demographic information by postal code using color fill, and
- Let me see sales by state using stacked bar charts
- Static maps available in simple HTML-based Web interface
SAP Business Explorer User Interface Prototype
Research Design Prototypes
- Develop new and more effective ways to visualize and analyze business
information
- Demonstrations of:
- Animation over time
- Alternate MapObjects renderers
- Combinations with other visualization tools
- Demonstrations developed with Visual Basic and MapObjects 2.0
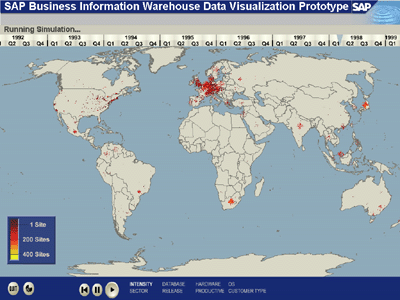
Animation Over Time
- Animating is a natural way to represent temporal changes in data
- People react instinctively to movement
- Which is why content-free Web animations are so annoying
- Powerful communication device
- More effective than manually changing time settings
Animation Example
Alternative MapObjects Renderers
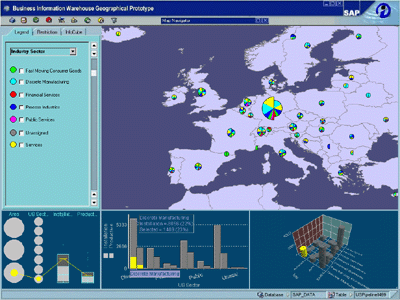
- Developing the repertoire of available GIS visualizations
- Split pie and stacked bar charts show multiple dimensions within a spatial
GIS display
- Split pie chart patent pending
- Initially developed for use in AfterLayerDraw event
- Now packaged as a MapObjects renderer for cleaner application code
Split Pie Example
Combinations with Other Visualization Tools
- GIS combined with alternative visualizations can be more powerful than
either alone
- Combinations can be on top of or beside the map
- Examples:
- Parallel coordinates for multidimensional displays
- 3D displays to show interaction among variables
- Once the data is geocoded, it can be analyzed with many different
visualization tools
3D Visualization Example

"Rolling Your Own" Prior to SAP BW 2.0
- SAP's r/3 and BW products have open interfaces that return ADO recordsets
- r/3's DCOM Connector lets you get BAPI table data as ADO recordsets
- BW 1.2 supports Microsoft's OLE DB for OLAP interface
- BW data returned as ADO recordsets or ADO MD cellsets
- Currently, MapObjects 2.0 requires copying this ADO data into an in-memory
table, using the MemFile extension
- Esri working on making MapObjects accessible to the r/3 SAPGUI
Conclusion
- SAP BW 2.0 to provide powerful GIS analysis capabilities, using MapObjects
embedded within the Business Explorer
- Researching innovative business GIS and visualization techniques for
future product releases
- Working on making GIS more pervasive throughout the SAP product line
Michael Good
Manager, Advanced User Interface Technology
SAP Labs, Inc.
3475 Deer Creek Road
Palo Alto, CA 94304, USA
michael.good@sap.com