L John Old
Abstract: Current web interfaces to non-Geographic data are primarily text (html) and GIF/JPEG-based. GIS are increasingly being used for spatial analysis of non-Geographic data, for example genome maps, document retrieval, and citation analysis. I discuss web-based, visual, interactive access to non-spatial data, using an internet map server. I will explain how, as an example, online visual browsing and search of lexical data may be achieved, and demonstrate some results of spatial analysis.
Introduction
Non-spatial data may be joined to geocoded files with matching attributes and displayed as regular maps. This is common in Geographic Information Systems (GIS). For example census information such as race or income, non-inherently spatial data, can be displayed as maps. Unfortunately non-spatial data often has no corresponding geocoded representation; yet valuable information may still be derived if the right representation can be found. By drawing on cartographic metaphors and representing non-spatial data as maps, or "information maps," the information in non-spatial data can be "spatialized," analyzed, browsed, and processed using GIS and cartographic methods, then shared on the web using internet map servers.
This paper discusses the spatializing of non-spatial data, the development of information maps, the processing of information maps (information cartography), and the advantages and capabilities of map servers for displaying non-geographic data.
Information maps
A map server can serve any raster or bit-mapped files, not just satellite imagery or aerial photographs, and these may be processed as image maps (an active clickable image that sends the user to different web pages depending on where they click on the image). A map server may also serve vector data such as networks. Information maps may therefore consist of images, points (analogous to cities), lines (analogous to roads or rivers) or polygons (analogous to states or countries).
Information maps are based on a substrate, usually an information object which is a mass noun and has quantitative values, implemented as a co-ordinate system. Once the decision of choice of substrate has been made, features can be manipulated to highlight facets of interest in the information. The "contents" of an information map are information objects, or landmarks, situated in the co-ordinate system. The landmarks are organized and displayed based on relations between (binary relations) and within them (unary relations, or features). Landmarks may be represented as points, icons, or images. Information features--properties of the information objects--can be used to modify the display attributes to produce different models that highlight facets of the information store. Facets may be hidden relationships or patterns in the data, as well as known relationships.
Information Cartography GIS modeling methodologies can be used to either bring attention to or create visually, trends, discontinuities, outliers, regularities, structures, clusters, or groupings (similarities within the data). All of the functions, display utilities, and models of GIS may be used, including representing data dimensions with perceptual dimensions such as color, size, and shape. Models may be unidimensional, planar, 3D, or mixed. Because coordinates are fixed, temporal models (dynamic models) must be simulated by sequences of snapshots. Transformations are possible between types of models by the transformation of spatial data-types--sets of points, lines, or polygons. Visual display can be expanded transformations in other dimensions such as the extension to contours or addition of statistical graphs. The example used in this paper is just one, simple example of information cartography. For more on information cartography and examples of applications, see Old, 1999b and 2000.Spatializing Non-Spatial Data
Existing attributes of non-spatial data can be used for spatial representation by converting the data to a form that has spatial attributes. For example distance metrics (dissimilarity, relevance, disutility, correlation) can be used to convert data to a spatial format using multidimensional scaling (MDS) techniques, factor analysis, Kohonen nets, clustering, geometric triangulation, or singular value decomposition. Categorical data also may be converted by assigning numeric indices and utilizing natural distributions in the data. (Old, 1999a, 1999b, 2000, 2001). Statistical packages such as SPSS can be used to create the X, Y coordinates via the MDS option. GIS systems such as Esri's ArcView (used to create the graphics presented here) can be used to import and manipulate the data as maps. Utilizing map servers the spatially enabled data can then be shared for remote interactive analysis via browsers. The steps are:
Web Access to Information Maps
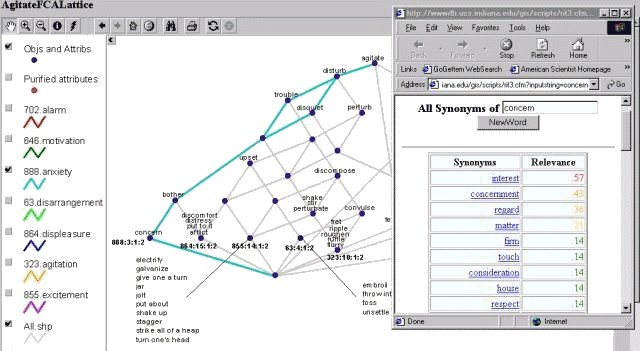
Figure 1 shows a formal concept lattice (Priss and Old, 1998) of the senses of "agitate" derived from Roget's International Thesaurus, displayed in a web browser using a Java applet. The map server used here is ArcView Internet Map Server extension.
The layers in the map key are the sets of synonyms associated with each sense of agitate in Roget's thesaurus (the 'intension' in lattice terminology). The points, or nodes, labeled by words are "formal concepts" shared by the senses. They are also "hot links" (clickable points which can invoke a URL or CGI script). The overlaid browser window shows the database result of clicking on the node labeled by the word "concern." The word concern was passed as a parameter, using http protocol, to an online relational database of Roget's thesaurus, implemented with Cold Fusion. By checking the boxes in the table of contents, or key, in the left-hand panel the words or synonyms of a sense are identified or highlighted (Figure 2). The higher a word is in the lattice the more senses it is shared by. Hence "agitate" is attached to the top concept. Some concepts are unlabelled because they represent the intersection of sets of words and senses. These can be derived by following the lines up to the words or down to the senses. For more on Formal Concept Analysis see Priss, 1998.
Java-based web interfaces to map servers are flexible to the degree that the server output can be manipulated in any way by the developer of the interface. However this paper is recommending web servers as a simple, out-of-the-box solution for researchers and scientists to display their data for interaction and manipulation. User-modification of the interface is still possible without effort by the developer because of the flexibility of the standard interface. In the examples given here it is possible to turn the table of contents off (a feature of the Java interface), but it is also possible to shrink the display in the window--unlike other html graphical displays. In other words this is a vector-based visualization so it can be zoomed in and out, whereas a graphic in an html window becomes obscured as the window is made smaller. Figure 3 demonstrates this (compare to Figure 1.).
Other features and display parameters can be manipulated by the user. For example the size and type of font and even special effects such as shadowing and glowing.
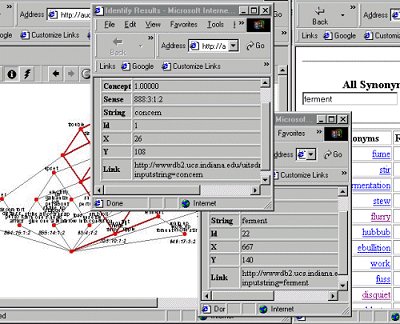
Figure 1 represents the relative position of the objects (concepts) in a Cartesian coordinate system. The X and Y values can be used to represent the same data in a GIS (analogous to cities and other GIS point data). Once the data are imported into the GIS, any of the powerful spatial analysis algorithms can be brought to bear. Each object on a map may have many numeric attributes associated with it. In a GIS the displayed data are kept in a relational database that can be manipulated by the system, queried by the user, or used to represent the output of spatial queries applied to the map. Any output or resulting models can also be displayed on the web for shared analysis. Figure 4. shows the information features for individual information objects in the "map," extracted from the database using the standard "i" information tool.
Using the standard Query button (the binoculars) the user can search for features in any or all layers of the map, and return multiple responses. This is demonstrated in Figure 5, where the search term "agitate" has returned the set {"agitate", "agitate a question"}. In Esri's ArcIMS full SQL queries can be developed taking advantage of all Boolean operators.
Any of the data associated with the objects on a map can be identified and displayed concurrently using a GIS. Clicking on an information object displays a tabular output of all of the data associated with that object. Using a spatial query or selection (click and drag) the same type of data can be displayed for a range of selected objects. Alternatively an SQL-type query can be made against the tabular data, and the result-set is highlighted both in the map and in the source table. The tabular data may reside in a remote relational database connected to the map server by a spatial data engine.
Spatial queries (relating to objects in a database that are indexed by a shared coordinate system) such as spatial intersection, containment (in), adjacency (next to), buffering, and proximity (near; far) and a large number of other operations commonly used in GIS, but unknown or uncommon in other fields of information retrieval, may be used.
A final exciting innovation is the ability of map servers to allow the addition of annotations to the information maps. Remote users may make annotations referencing spatial objects with the mouse and adding text.Limitations
Preparing data using a GIS and serving it through a map server may have limitations but this author has yet found only two. First, all data is in a fixed coordinate system. Whereas in the fields of scientific or information visualization the relative positions of information objects or data points may be important, the absolute position may not be. For example a graph or network of nodes and arcs may be more easily understood if it can be manipulated to place nodes in different positions. Maps and therefore GIS and map servers are not designed this way. Cartographers rarely want to change the relative position of Paris, to London and New York (projections aside).
Time series data have not been demonstrated here as they are difficult to deal with in a GIS. The development of a conceptual model and associated tools for the visualization of spatial-temporal process information is among the goals of the Commission on Visualization of the International Cartographic Association (ICA, 1997). Animated sequences of maps is one potential solution to the spatio-temporal problem. However this requires considerable preprocessing to generate interim data sets for the transitional maps.
Conclusion
This paper has discussed the spatializing of non-spatial data, the development of information maps, information cartography--the processing of information maps, and some of the advantages, capabilities, and limitations of map servers for displaying non-geographic data. Map servers have the capability of displaying any non-spatial data developed using principles from information cartography, and facilitating the manipulation of display parameters and a range of query types for retrieval and analysis online.
Map servers have even greater potential for displaying non-spatial data if the model builder is willing to invest in development. The Esri Internet Map Server demonstration page illustrates many of the attractive features of map servers which could be seconded to the web display of scientific and information visualization.
"The application of GIS is limited only by the imagination of those who use it." -Jack Dangermond President, Esri
References
Esri (2000). ArcView GIS and IMS Extension. Available:
http://www.Esri.comInternational Cartographic Association Commission on Visualization (August 1997), Overview. Available:
http://www.geovista.psu.edu/sites/icavis/com_overview.htmlOld, L. J. (1999a). Spatial Representation of Semantic Information.MAICS99 presentation notes. Available:
http://php.indiana.edu/~jold/maics/maics.htmOld, L. J. (1999b). Spatial Representation and Analysis of Co-Citation Data on the "Canonical 75": Re-viewing White and McCain. Available:
http://php.indiana.edu/~jold/SLIS/L710/L710.htmOld, L. John, (2000). Using Spatial Analysis for Non-spatial Data. Proceedings, Esri International Users' Conference, San Diego, CA, July 2000. Technical Paper in the Modeling stream. Available
http://proceedings.Esri.com/library/userconf/proc00/professional/papers/PAP196/p196.htm).Old, L. John, and Priss, Uta, (2001). Metaphor and Information Flow. In: Proceedings of the Twelfth Midwest Artificial Intelligence and Cognitive Science Conference (MAICS'2001), Ohio, April 2001.
Old, L. J., (2001). Utilizing Spatial Information Systems for Non-Spatial-Data Analysis. Scientometrics, Vol. 51, No. 3 (2001) 563–571.
Priss, U. (1997). A graphical interface for document retrieval based on formal concept analysis. In: E. Santos (Ed.), Proceedings of the 8th Midwest Artificial Intelligence and Cognitive Science Conference. AAAI Technical Report CF-97-01, 1997
Priss, U. (1998). A Formal Concept Analysis Home Page. Available at
http://php.indiana.edu/~upriss/fca/fca.htmlPriss, U., and Old, L. J. (1998). Information Access through Conceptual Structures and GIS. In: Information Access in the Global Information Economy. Proceedings of the 61st Annual Meeting of ASIS, 1998, p. 91-99
Roget's International Thesaurus, 3rd Edition, Thomas Crowell Co., 1963.
Author Information
L. J. Old
GIS Specialist and Senior Database Analyst
Indiana University
2711 East Tenth Street
Bloomington, IN 47408
Phone: 812-855-7705
FAX: 812-856-5242
jold(at)indiana.edu