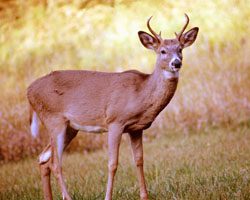
Figure 1: The North American white-tailed deer, male (photograph from DNR files).
The Wildlife Division of the Michigan Department of Natural Resources (DNR) is developing historical investigations into trends in white-tailed deer (species Odocoileus virginianus) populations within the state's 83 counties. A new methodology was developed from conceptual models and methods similar to those used by the Wisconsin DNR and those investigated by Illinois DNR research cooperators. The new ArcInfo processing methodology allowed processing detailed statewide landuse/landcover data, to generate county estimates for both a conservative estimate and a liberal estimate of deer forage/browse and cover categories. Conservative and liberal estimates were developed because the detailed landuse/landcover data allows overlap in the defined categories.
Key words: white-tailed, landuse, landcover, habitat modeling, Michigan.
Paper subject category: Forestry, Wildlife, and Fisheries Management.
Paper theme category: Technical Tips and Methods.
Topic will be most useful for: A Specific Industry or Application Area.
This paper features the following Esri software: ArcInfo, ArcView.
A brief introduction may be needed for those unfamiliar with the North American white-tailed deer, species Odocoileus virginianus and other member of the Cervidae family (which includes deer, elk, and moose - antler-bearing ungulates or even-toed hoofed mammals), as shown in Figure 1. Males grow antlers annually. These typically brown-furred, medium-sized mammals are herbivorous prey animal which have excellent hearing, sense of smell, vision clarity, coordination, and running speed up to 30 miles per hour (48 kilometers per hour) for short distances (Robinson and Bolen 1989; Langenau 1994). White-tailed deer reach reproductive age at typically 1-2 years of age, reach maturity at approximately five years old (typically when maximum body size and maximum antler size in males), and have rarely been known to live 12-15 years of age (dental wear becomes significant). Deer are both capable of stealthful elusiveness in nature and of becoming habituated to human-related food sources in rural/urban areas (MDNR 2000). With access to reasonable cover and adequate forage/browse, these animals are capable of surviving prolonged cold temperatures, snow cover, and stresses of north-temperate climatic changes. This common game species ranges throughout the majority of the North American continent, except many areas west of the Continental Divide and colder areas towards the north, which is approximately the southeastern two-thirds of the continent (Robinson and Bolen 1989).
Figure 1: The North American white-tailed deer, male (photograph from DNR files).
Michigan is in the northern portion of the white-tailed deer geographic range and is home to the northern subspecies (species Odocoileus virginianus v. borealis), which is one of the largest. Typical yearling weight is 120-150 pounds (161-242 kilograms, live weight), occasional mature deer weigh 200-250 pounds (322-403 kilograms), with the current record weight of 354 pounds (570 kilograms) (Langenau 1994). Most harvested deer in Michigan are not fully mature (5 years or older); typical harvest age is 1.5 to 2.5 years of age. Figure 2 shows the geographic spread of the State of Michigan, composed of 57022 square miles, two major peninsulas, and 83 counties (MDMB 2001). White-tailed deer live in every county of Michigan, use many different habitat types, and have undergone several population oscilations since Michigan was first settled in 1622-1701 (Langenau 1994; Ozoga, Doepker and Sargent 1999; Sargent and Carter 1999). In many areas hunters harvest approximately one quarter the population, with about 47 percent of hunters successfully harvesting a deer last year (Frawley 2001). Current deer populations are estimated at nearly two million deer; regional deer populations in northern Michigan are more affected by severe winters than those in southern Michigan, where deer are abundant (Langenau 1994; Ozoga, Doepker and Sargent 1999). The state human population is approximately 9.9 million persons; the majority of human residents in Michigan live in the southern third of the state, particularly the southeastern areas near Detroit (MDMB 2001).
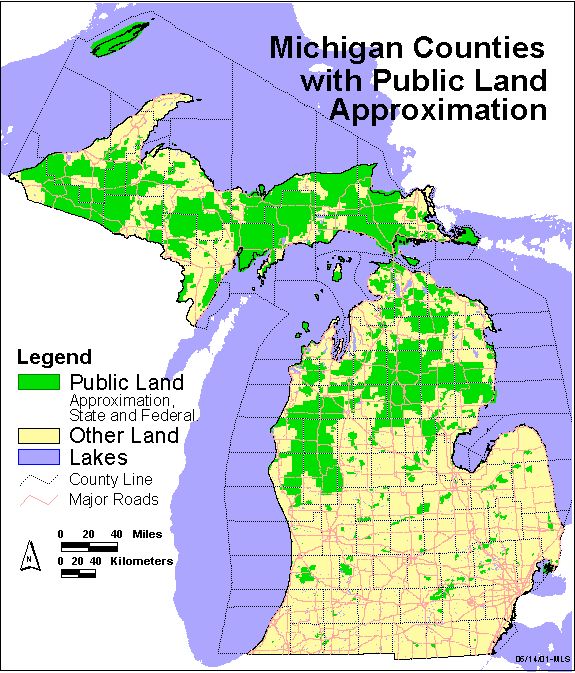
Figure 2: General locator map of Michigan, with the
extent of public land (state and Federal land, approximation).
The Michigan landscape is characterized by 51.5 percent forest, 21.8 percent cropland/ agriculture, 22.7 percent other (includes developed areas, wetland/marsh, scrub/shrub, grassland, etc.), 2.9 percent water (fresh water, excluding Great Lakes water shown in blue in Figure 2), and 1.1 percent pasture (Kleweno and Pscodna 1997). The state includes over 3.9 million acres of state forest land and over 2.7 million acres of national forest; public land comprises approximately 23 percent, and portions are extensively used for human recreation, hunting, and wildlife conservation. Figure 2 also shows the extent of Michigan's public land. Deer habitat in the Great Lakes area, which includes Michigan and states surrounding the Great Lakes of North America, has been described as areas including minimal forest cover for protection near to sufficient browse of young shoots of trees and smaller plants combined with forgeable herbaceous plants (Langenau 1994; MDNR 2000; Ozoga, Doepker and Sargent 1999; Robinson and Bolen 1989; Sargent and Carter 1999). Michigan abounds with a mix of forested cover combined with cropland and grassland areas which can be used as browse or forage. Michigan does have thriving forestry and agricultural industries, historical farmlands, and a mix of remote-outlying northern lands to spreading rural areas to heavily developed urban areas with parks (Kleweno and Pscodna 1997); all of these areas are either utilized or potential deer habitat.
Historically, Michigan deer management began in the mid-1800's when the abundant wild deer populations in southern Michigan were being used as a primary meat supply for residents and were being used as a market product shipped out of state (Langenau 1994). Deer as a resource was believed inexhaustible, until harvesting significantly reduced the population in 1870 (Langenau 1994). Regulations and deer management began with the first Michigan law regulating the hunting season in 1859, hunter licensing began in 1894, and management and regulation still continues (Langenau 1994). Organized and scientific game management approaches began in 1928 with the creation of the Game Division within the Michigan Department of Conservation, and throughout it's history, this Division has always included advancing management techniques with studies on deer population dynamics (Langenau 1994). In 1930, the abundance of deer was recognized and this was the beginning of concerns over human safety due to increasing car-deer accidents (Langenau 1994). Early management of deer populations was not predictive but predominantly based on analysis of harvest results. Modern management planning still includes post-harvest and other field surveys, and has begun to include predictive population modeling, landscape dynamics, and more. Today, the Wildlife Division of the Michigan Department of Natural Resources (MDNR) includes ecosystem planners, geographic information system analysts, and other specialists across the scientific disciplines which are committed to sound scientific management of Michigan's resources including game and non-game species.
Management of white-tailed deer in Michigan is based on several long-term goals (MDNR 1998, Langenau 1994). Deer populations must be managed in balance with its habitat for a healthy population. These populations must be maintained at levels appropriate for the carrying capacity of the ecosystem and at levels appropriate for human safety, social, economic, and recreational needs. Human needs include providing diverse and quality outdoor experiences for hunters and wildlife viewers, in balance with habitat considerations. Towards reaching these management goals, for over 50 years, the MDNR Wildlife management staff has used numerous tools at estimating the population size, condition, and extent of deer in Michigan (MDNR 1998). Some of these tools include mail surveys of deer hunters, summer deer observations, field surveys, pellet group surveys, dead deer transect surveys, traffic surveys, car-deer crash trends, and voluntary biological data collection during seasonal check-stations when hunters bring in harvested deer (MDNR 1998). Research has always been an important component of improving deer management, and Michigan wildlife managers have begun using more advanced technology and techniques when studying wildlife species (MDNR 1998; Langenau 1994).
As a species, white-tailed deer are remarkably adaptive, and integrate well into urbanized areas as long as minimum cover and forage/browse requirements are met. Urban and rural deer populations can pose a serious problem to human populations, ranging from crop damage, interactions with farm livestock, car-deer accidents, and basic pest behavior (MDNR 1999; MDNR 2000; Armstrong 2000). Over the last several decades, the incidents of car-deer crashes have been increasing as have concerns over human safety on roadways throughout Michigan (Langenau 1994; Ozoga, Doepker and Sargent 1999). Attitudes and perceptions of the general public impact management and the deer population in such areas as recreational feeding, baiting and hunting practices, and other policies (MDNR 2000; Langenau 1994, Ozoga, Doepker and Sargent 1999). Due to the complexity of humans co-existing with deer and other wildlife in Michigan, today's management methods must include communication and cooperative efforts with hunter groups, private landowners, and other interested persons (MDNR 2000; Langenau 1994; Ozoga, Doepker and Sargent 1999; Sargent and Carter 1999). These and other concerns have brought significant public attention to deer management activities and have shown the need for more information about deer in Michigan to assist management.
Other states face similar deer management problems and have taken approaches to improve management methods and information resources (Armstrong 2000; Roseberry and Woolf 1998; WDNR 1998; Vander Zouwen and Warnke 1994). A key information resource to developing good management plans for deer populations is having relevant and sufficient landscape information about prospective deer habitat. Investigating new approaches taken in adjoining states, new ideas may be seen which may be combined with existing knowledge, to improve information in Michigan. Using a geospatial or GIS-based approach is not a new concept, as deer habitat mapping has been performed in past years using satellite imagery analysis (Ormsby and Lunetta 1987). The difficulty is fine-tuning the data development so the amount of habitat is neither under- nor over-estimated.
The objective of the development work discussed in this paper was to derive an applicable methodology for identifying potential cover and forage/browse for white-tailed deer, after investigating comparable methodologies used in adjoining states, specifically those of Wisconsin and Illinois.
Wisconsin contains more forested areas than Illinois, and the Wisconsin approach utilized historical information on deer range based on assessment of local land managers using aerial photography and satellite imagery. Wisconsin managers identify deer habitat as cover (permanent cover including forest, woodlot, brush-covered land or marsh, etc.) at least 10 acres in size and the adjacent local fields within 330 feet (100 meters) to these cover areas (WDNR 1998). Using this method, Wisconsin deer habitat was estimated at 61.7 percent in 1988 to approximately 62 percent in 1998 (Vander Zouwen and Warnke 1994; WDNR 1998). Wisconsin also has another valuable data resource as Wisconsin has had required registration of every harvested deer since 1953; this provides a firm foundation for data development and building trend analysis of deer on the landscape (WDNR 1998). Managers also estimated that deer generally have a seasonal home range of about one square mile (2.6 square kilometers) in Wisconsin (Vander Zouwen and Warnke 1994; WDNR 1998). Wisconsin managers started with a conceptual model, and have moved on to a GIS-based model which is based on landuse/landcover analysis.
Illinois contains more agriculture-related areas than Wisconsin and also contains more agricultural areas when compared to Michigan. Illinois researchers investigated Wisconsin methodology, and made adaptations based on analysis using ancillary data on county and local level resources (Roseberry 1995; Roseberry and Woolf 1998). In the revised Wisconsin method, researchers considered deer habitat as areas at least two hectares in size, and included cover (defined as closed-canopy forest, open-canopy forest, coniferous forest, and bottomland forest) areas and adjacent forage (defined as row crops, small grain crops, native and range grassland, and orchards) in the state (Roseberry and Woolf 1998). Cover was categorized into three groups: optimum for areas within 500 meters of forage, marginal for all areas outside optimum but within 1000 meters, and usable for areas outside marginal beyond 1000 meters. Forage was categorized into three groups: optimum for forage areas within 200 meters, marginal for all areas outside optimum but within 500 meters, and usable for areas outside marginal up to 1000 meters. Researchers worked in a grid or raster-based system for modeling.
Illinois researchers used a detailed population density reconstruction to derive estimates of deer density, based similarly on required registration of every harvested deer (Roseberry and Woolf 1998). Researchers also assigned a preferential level for cover and browse based on landuse deer behavior studies, but cited disagreement in scientific literature regarding deer use of bottomland forest (Roseberry and Woolf 1998). Regression analysis of the Illinois browse and forage data indicated the optimum-level (2 hectare min., 200 and 500 meter distances) of cover with forage was the best predictor of deer population (Roseberry and Woolf 1998). Illinois deer habitat was estimated at 31 percent optimum to approximately 48 percent optimum plus marginal (Roseberry and Woolf 1998). Illinois researchers started with a conceptual model, investigated the Wisconsin methodology, and have moved on to a GIS-based model which is based on landuse/landcover analysis (Roseberry and Woolf 1998).
Illinois researchers also compared a slightly modified Wisconsin methodology, which defined deer habitat as those areas at least four hectares in size and including forage within 100 meters from cover (330 feet) for the Illinois landuse/landcover (Roseberry and Woolf 1998). They estimated that density based on the Wisconsin methodology was less than 50 percent of the maximum biological carrying capacity (Roseberry and Woolf 1998). The researchers stated that a total forest area estimate, such as by remote sensing methods, can be applicable for deer habitat over larger areas; this seems to support some of the differences in approach based on Wisconsin's greater composition of forest lands as compared to the highly fragmented Illinois forest areas.
The northern peninsula of Michigan is similar to Wisconsin landscape, even those areas in the northern portions of the southern peninsula. The southern portion of the state have many similarities to Illinois's fragmented forest cover mixed with agricultural areas. Portions of the northern peninsula are also fragmented forest cover mixed with agriculture. The Wisconsin approach has been used for a longer period than the approach developed by the Illinois researchers. In the Illinois approach, the use of assigned preference for cover or browse did not appear to improve the Illinois approach, and they cited their model was relatively insensitive to minimum patch size and optimum inter-patch distances, which helped support their agreement with other researchers that coarser remote sensing methods can be applicable. The added complexity of the three categories of browse and cover combined with the preference levels did not appear to improve the estimate but does add to the difficulty in processing. The Illinois researchers did identify the best predictor of deer population was the optimum categorical approach (using two hectares min., 200 meter buffer distance). Additionally, the Illinois researchers did state the Wisconsin approach seemed to underestimate deer habitat (Roseberry and Woolf 1998), which was our preliminary opinion based on discussions with Michigan deer specialists.
Therefore, we determined a combination approach is an applicable and valid approach. Plans were to use information based on landuse/landcover types similar to Wisconsin, combined with minimum areas of two hectares, with forage/browse areas within 200 meters of cover. This appears to be an applicable compromise which may yield more accurate and simplified-processing towards deer habitat estimates versus either approach alone. We planned to also investigate the modified Wisconsin approach used by the Illinois researchers, which used minimum areas of four hectares with forage/browse areas within 100 meters of cover.
Data processing used two systems (a data server and a system running local versions of the data), and both were Dell IBM-compatible systems, with 450 megahertz Pentium III processors and 512 megabytes of RAM. Software used for processing was Workstation ArcInfo, version 8.0.1 to 8.0.2, from Environmental Systems Research Institute, Inc. (Esri), Redlands California, United States of America, copyright 1982-2000. Output maps for this publication were created using upgraded Dell IBM-compatible systems, with 1 gigahertz Pentium III processors and 512 megabytes of RAM, using software ArcView, version 3.2a, from Environmental Systems Research Institute, Inc. (Esri), Redlands California, United States of America, copyright 1992-2000. Processing utilized the Arc Marco Language (AML) approach which allowed automated batch processing of data, ran overnight to minimize impact to other GIS users during regular work hours.
Source landuse/landcover data was the latest statewide resource which could be located that contained the same or comparable levels of detail as the Wisconsin landuse/landcover; this resource was developed by the Michigan Resource Information System (MIRIS) in 1978 (DNR). This data resource has a 30 meter spatial resolution in a native raster environment, derived from 1:24000 scale color infrared aerial photography, with minimum mapped unit of 2.5 acres, and classified down to a hierarchical 4th-degree level (or a modified Anderson Level IV) of detail. Specifics about this data resource are very lengthy and are available online - therefore the author directs those interested to review the resources included as appendices: Current Resource Inventory Classification Definitions (MIRIS 1981), Detailed Forest Inventory Supplement (MIRIS 1985), and FGDC-compliant metadata about the MIRIS dataset. These references and other information are also provided by the MDNR Spatial Data Library site at "http://www.dnr.state.mi.us/spatialdatalibrary/" (or information also available at an alternate, cooperator site for Michigan State University's Center for Remote Sensing and Geographic Information Science at "http://www.crs.msu.edu/lclu/").
Other newer regional landuse/landcover datasets exist, but these do not "crosswalk" well or make a complete comparative match to allow seamless integration and also do not include the southern portion of the southern peninsula of Michigan. The newest or most recent landuse/landcover for the southern third of Michigan is the 1978 MIRIS data. Therefore, we determined a single statewide data layer as more desirable, even if from 1978, for this methodology development. Ongoing state land-classification activities could provide data for later processing and refinement of the approach developed with the 1978 MIRIS data.
The original county-based 1978 MIRIS data had been previously converted and seamed into statewide grid coverage in ArcInfo. This grid coverage was converted to a polygon coverage for processing. The resulting polygon coverage, with an ArcInfo fuzzy tolerance of 0.171m to maintain shapes for buffering, was the source layer for reclassification.
The Illinois landuse/landcover data was in more general categories than the 1978 MIRIS data available for Michigan. Therefore, a decision was made to investigate the differences, and similar to the Illinois methodology of developing an optimum and marginal habitat type, we investigated steps to identify a conservative and more liberal (less conservative) criteria based on the differences in landuse/landcover used by the Wisconsin and Illinois researchers as compared to the higher detail in the 1978 MIRIS dataset. Upon consideration, we wanted to identify these two categories, which will be called "conservative" and "more-liberal" in our approach, in order to allow some comparisons of results.
We investigated and evaluated the differences, and derived a conservative "crosswalk" based on the Illinois landtypes, and a more liberal "crosswalk" using the 1978 MIRIS categories. Conservative cover included: various combinations of upland forested areas, and lowland forest (MIRIS level 4 values of 4000-4295, 6110). More-liberal cover included: orchards, upland scrub/shrub (considered marginal/ poor cover), and lowland scrub/shrub (MIRIS level 4 values of 2200, 3200, and 6120). Conservative forage/browse included: crops, upland herbaceous/grassland, and upland savanna (MIRIS level 4 values of 2100-2200, 3200, and 3300). More-liberal forage/browse included: upland rural/urban grassland (including parks, industrial and commercial green margins, golf courses, etc.), confined feeding areas or pasture, other agriculture, lowland herbaceous/grassland, and wetland/marsh (MIRIS level 4 values of 1900-1940, 2300-2900, and 6200-6240). All other values were eliminated (MIRIS level 4 values of 0000-1734, 5100-6000).
The landuse/landcover data was reclassified into the five categories (conservative cover, conservative forage/browse, more-liberal cover, more-liberal forage/browse, and no-data), which is considered four processing categories as the no-data areas were eliminated from the processing. For the conservative estimation, areas at or below the minimum four hectares were eliminated, and then cover areas were buffered 100 meters to allow identifying all conservative forage/browse within 100 meters. For the more-liberal estimation, areas at or below the minimum two hectares were eliminated, and then cover areas were buffered 200 meters to allow identifying all conservative forage/browse within 200 meters.
The entire state was processed in county-sized sections; larger counties (like those in the northern peninsula of Michigan) required subdivision into two or three portions to allow complete processing due to errors caused by larger file sizes in Workstation ArcInfo. Unexpected problems with file size and structure resulted from keeping the 30 meter source data at its original spatial resolution and from not raising the processing tolerances. This resulted in larger final file sizes than were expected before processing was completed. However, processing was completed, and the results appeared satisfactory based on qualitative comparison to source landuse/landcover. The qualitative review was done with staff familiar with regional landscapes, field conditions, and deer population dynamics. No formal quantitative measure or accuracy assessment has been done and probably will not be done due to the age of the source data.
A sample of the results is provided, with the location of the sample shown in Figure 3. The sample, shown in Figure 4, is a Lake Huron shoreline portion of Arenac County near the City of Au Gres, Michigan. In the sample, the conservative cover and forage/browse can be seen with the more liberal cover and forage/browse. Comparison of the results from the conservative and more-liberal estimates does show differences, as expected.
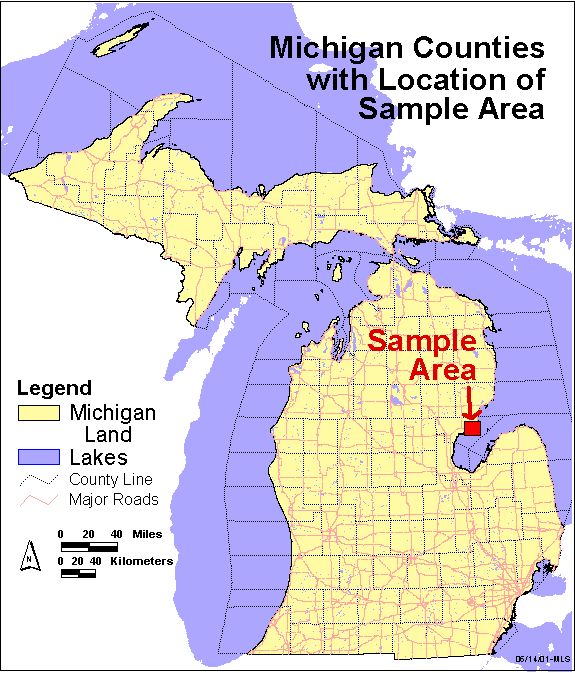
Figure 3: Locator map for sample results in Michigan.
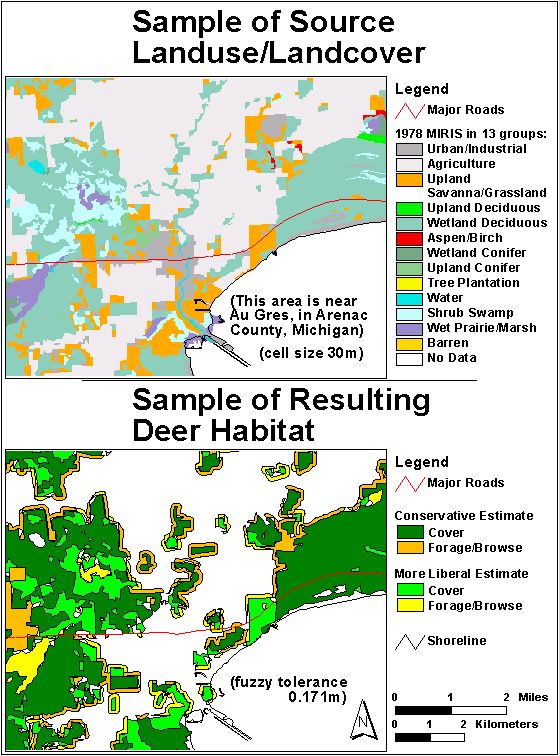
Figure 4: Sample source data and results, for area near City of Au Gres, in Arenac
County, Michigan.
For the 1978 source data for Michigan, this state-wide approach generated the following estimates: conservative cover is 44.9 percent; more-liberal cover is 51.8 percent; conservative forage/browse is 10.1 percent; and more-liberal forage/browse is 15.5 percent. These values are from total state-wide percents of: conservative cover at 49.5 percent; more-liberal cover at 56.3 percent; conservative forage/browse at 32.6 percent; and more-liberal forage/browse at 35.4 percent. Therefore, deer habitat appears 90-92 percent of what could be categorized as cover, and 31-43 percent of what could be categorized as forage/browse. Deer habitat might be represented conservatively as 44 percent cover and 10 percent forage/browse, and more-liberally as 52 percent cover and 15 percent forage/browse, based on the 1978 MIRIS data; total deer habitat in Michigan is a conservative 54 percent to a more-liberal 67 percent.
Complete results for the 1978 MIRIS landuse/landcover data are still under review during completion of a Wildlife Division report (Strong 2001). In order to distribute the data to interested staff at field offices, the tolerance values may need to be manipulated, and the coverage generalized; the final coverage is quite large and exceeds typical ease-of-use expectations.
The introduction contains sufficient supporting information on the importance of why greater deer habitat information is needed, and why deer management is very important and an ongoing activity. The objective of this development work was completed; a GIS-based application has been developed for deriving an applicable methodology, based on preliminary analysis and on use of component information in adjoining states, for identifying potential browse and cover for white-tailed deer. Qualitative assessment of the methods and results was completed. A set of automated Michigan "map tools" based on the 1978 MIRIS data is now available for consideration, further discussion, and possible development.
When the development work first began, the original objective did not specifically include the concept of conservative and more-liberal estimators for cover and forage/browse. However, mixed landuse/landcover categories like golf courses and orchards have been observed being used by deer as both forage/browse and cover, so conceptually, they could be considered both cover and forage/browse. This does not mean these areas are double-counted, but that when represented geographically, they are included to provide an improved estimate of actual habitat usage by deer.
Investigations on comparable methodologies used information from adjoining states of Wisconsin and Illinois, and showed that a combination of both methods may be more applicable in Michigan than just one approach, when considering difficulties with the method or the results of each approach. The conservative and more-liberal estimators could be seen as similar qualifiers as the optimum and marginal estimates from the Illinois approach, yet were easier to process than the Illinois approach. Using the two estimators also provides a range which appears less inarguable than a single value, as they are identified as "conservative" and "more-liberal" estimates of deer habitat. The optimum and marginal values and habitat preferences are still being argued in the scientific publications, as more studies are being conducted to identify these dynamics in deer populations.
Using these two estimators, we feel we can more correctly identify the potential deer habitat, rather than using a single value, because detailed information about exact landtype utilization by deer is still more general than some of the existing landuse/landcover data resources. Based on the Illinois researchers analysis of using a modified Wisconsin approach (4 hectares min., 100 meter buffer) and observations that the Wisconsin approach may greatly underestimate deer habitat; we feel our conservative estimator (generated using four hectare min., 100 meter buffer) should represent potential habitat and may underestimate extents. The preliminary results from this project have already been used in comparative discussions of deer habitat trends, but the 1978 source data does have limited application for today's management practices due to being over 20 years old. Newer source landuse/landcover data is required to allow generation of current deer habitat using this method.
Future application development and research is already planned. Expected directions for development from these methods are to apply these methods to new landuse/landcover data, when it is available. Currently, the Michigan Department of Natural Resources is implementing the Integrated Forest Monitoring Assessment and Prescription (IFMAP) project. This is a multi-phase project that integrates remote sensing, GIS, and on-the-ground resource inventories into a decision support system and several specific data products. Department goals are that IFMAP will support holistic ecosystem management and provide landscape information resources that can be used in many management areas; we hope it will provide a new and valuable habitat information resource. Current plans are that new state-wide landuse/landcover data, being developed from Landsat Thematic Mapper satellite imagery, will be available by late October 2002. These data represent a potential source for generating new estimates of deer habitat along similar approaches as what was developed with the 1978 MIRIS data and discussed in this publication.
The author would like to acknowledge and thank the following professional staff at the State of Michigan, Department of Natural Resources (MDNR), for expertise and cooperation related to specific background questions or development steps: John W. Urbain, Harry R. Hill, William E. Moritz, Brian J. Frawley, Alexander C. Weinhagen, and Michael L. Donovan. Thanks to DNR ViGIL for use of conference ticket, and to Paula Gotcher for editing assistance. John W. Urbain, the Big Game Specialist (state deer specialist) for the MDNR Wildlife Division, is particularly recognized for requesting development of geographic information system (GIS) data and methodology, and then working out of his element with GIS to assist development of this project. Dr. Harry R. Hill is specifically recognized for his contribution of mentorship and historical expertise in Michigan including field surveys of deer populations.
Armstrong, Kevin Michael. 2000. Deer-related automobile accidents: using GIS and GPS to analyze trends and find solutions. Proceedings of the 20th Annual Esri International User Conference, 2000 June 26-30. Environmental Systems Research Institute, Inc. (Esri), Redlands California, United States of America, (7 pages).
Frawley, Brian J. 2001. Michigan Deer Harvest Survey Report - 2000 Seasons. Michigan Department of Natural Resources (MDNR) Wildlife Division Report number 3344. State of Michigan, MDNR, Wildlife Division, Lansing, Michigan, United States of America. (32 pages) (Document is online at http://www.dnr.state.mi.us/).
Kleweno, David D. and Steve J. Pscodna. 1997. Michigan County Agricultural Statistics 1996. Michigan Department of Agriculture (MDA) report. Produced and printed cooperatively by the MDA, Lansing, Michigan, United State of America, and the United States Department of Agriculture, National Agricultural Statistics Services, Washington D.C., United States of America. (approx. 250 pages, with illustrations) (Document is online at http://www.mda.state.mi.us/).
Langenau, Ed. 1994. 100 Years of Deer Management in Michigan. Michigan Department of Natural Resources (MDNR) Wildlife Division Report number 3213. State of Michigan, MDNR, Wildlife Division, Lansing, Michigan, United States of America. (16 pages, color illustrations) (Document is online at http://www.dnr.state.mi.us/wildlife/pubs/deer_100years.asp).
MDMB. 2001. Michigan Facts and Figures 2001. Michigan Department of Management and Budget (MDMB) informational brochure. State of Michigan, MDMB, Lansing, Michigan, United States of America. (1 page) (Document is online at http://www.state.mi.us/dmb/mic/ ).
MDNR. 1998. Estimating Deer Numbers. Michigan Department of Natural Resources (MDNR) Wildlife brochure. State of Michigan, MDNR, Wildlife Division, Lansing, Michigan, United States of America. (1 page) (Document is online at http:// www.dnr.state.mi.us ).
MDNR. 1999. Bovine Tuberculosis in Michigan. Michigan Department of Natural Resources (MDNR) Wildlife brochure. State of Michigan, MDNR, Wildlife Division, Lansing, Michigan, United States of America. (1 page folded, color illustrations) (Document is online at http://www.bovinetb.com).
MDNR. 2000. Considerations for people who feed deer and other wildlife. Michigan Department of Natural Resources (MDNR) Wildlife brochure. State of Michigan, MDNR, Wildlife Division, Lansing, Michigan, United States of America. (1 page folded, color illustrations) (Document is online at http:// www.dnr.state.mi.us ).
MIRIS. 1981. Current use inventory classification definitions, May 1981. Documenting categorized digital data for the 1978 Michigan Resource Information System (MIRIS) landuse/landcover. State of Michigan, Department of Natural Resources, Lansing, Michigan, United States of America. (15 pages) (Information is online at http://www.dnr.state.mi.us/spatialdatalibrary/ ).
MIRIS. 1985. Detailed forest inventory supplement, 1985. Documenting categorized digital data for the 1978 Michigan Resource Information System (MIRIS) landuse/landcover. State of Michigan, Department of Natural Resources, Lansing, Michigan, United States of America. (15 pages) (Information is online at http://www.dnr.state.mi.us/spatialdatalibrary/ ).
Ormsby, J. P. and R. S. Lunetta. 1987. Whitetail deer food availability maps from thematic mapper data. Photogrammetric Engineering and Remote Sensing 53: 1585-1589. American Society for Photogrammetry and Remote Sensing. (4 pages, illustrations) (Information is online at http://www.asprs.org/).
Ozoga, John J., Robert V. Doepker and Mark S. Sargent. 1999. Ecology and Management of White-tailed Deer in Michigan. Michigan Department of Natural Resources (MDNR) Wildlife Division Report number 3209. Produced cooperatively by the MDNR and the Michigan Involvement Committee of the Michigan Chapters of Safari Club International. Printed by the Michigan Involvement Committee of the Michigan Chapters of Safari Club International, Lansing, Michigan, United States of America. (73 pages, with illustrations) (Information is online at http://www.dnr.state.mi.us/ ).
Robinson, William L. and Eric G. Bolen. 1989. Wildlife Ecology and Management, second edition. Macmillan Publishing Company, New York, New York, United States of America. (574 pages, color illustrations).
Roseberry, John L. 1995. Illinois deer harvest analysis and modeling program (IDHAMP): user's guide and reference manual. Cooperative Wildlife Research Laboratory, Southern Illinois University, Carbondale, Illinois, United States of America.
Roseberry, John L. and Alan Woolf. 1998. Habitat-population density relationships for white-tailed deer in Illinois. Wildlife Society Bulletin 26(2):252-258. The Wildlife Society. (7 pages) (Information is online at http://www.wildlife.org/).
Sargent, Mark and Kelly Siciliano Carter (editors). 1999. Managing Michigan's Wildlife: a Landowners Guide. Produced cooperatively by the Michigan Department of Natural Resources (MDNR), the Michigan United Conservation Clubs (MUCC), and Michigan State University. Printed by MUCC, Lansing, Michigan, United States of America. (304 pages, with illustrations) (Document is online at http://www.dnr.state.mi.us/wildlife/Landowners_Guide/Introduction/TOC.htm).
Strong, Marshall. 2001 (pending). Derivation of Michigan's deer habitat cover and forage/browse from 1978 MIRIS Landuse/Landcover. Michigan Department of Natural Resources (MDNR) Wildlife Division report pending/in-progress. State of Michigan, MDNR, Wildlife Division, Lansing, Michigan, United States of America. (pending).
Vander Zouwen, William J., and D. Keith Warnke. 1994. Wisconsin deer population goals and harvest management environmental assessment. Wisconsin Department of Natural Resources (WDNR) publication PUBL-WM-49-94. State of Wisconsin, Department of Natural Resources, Bureau of Wildlife Management, Madison, Wisconsin, United States of America. (327 pages, illustrations) (Information is online at http://www.dnr.state.wi.us/).
WDNR. 1998. Wisconsin's deer management program: the issues involved in decision-making, second edition. Wisconsin Department of Natural Resources (WDNR) publication PUBL-SS-931-98. State of Wisconsin, Department of Natural Resources, Bureau of Wildlife Management and the Bureau of Integrated Science Services, Madison, Wisconsin, United States of America. (40 pages, illustrations) (Information is online at http://www.dnr.state.wi.us/).


"The Michigan Department of Natural Resources is committed to the
conservation, protection, management, use and enjoyment of the State's
natural resources for current and future generations."
For more information on Michigan's natural resources, please see the Michigan Department of Natural Resources website at http://www.dnr.state.mi.us , or for specific information on white-tailed deer, please see http://www.dnr.state.mi.us/Game.asp?Animal=52&LinkID=4&sec=hunt . For other information about Michigan, please see the State of Michigan website at http://www.state.mi.us .
Strong, Marshall. 2001. Generation of white-tailed deer (Odocoileus virginianus) forage/browse and cover Estimates from Michigan landuse/landcover data (1978 MIRIS). Proceedings of the 21st Annual Environmental Systems Research Institute, Inc. (Esri) International User Conference 2001, 9-13 July 2001. Published by Environmental Systems Research Institute, Inc. (Esri), Redlands, California, United States of America. (10 pages, illustrations).
For more information about Esri, please see the website at http://www.Esri.com/ , or for specific information on the users conference, please see /www.Esri.com/uc/ .