(click for larger image)
Laura R. H. Biewick, Gregory L. Gunther and Christopher
C. Skinner
U.S. Geological Survey, Denver, Colorado 80225
The U. S. Geological Survey (USGS) Central Energy Resources Team (CERT) in Denver, Colorado, is providing National Oil and Gas Assessment (NOGA) results online at http://energy.cr.usgs.gov/oilgas/noga. High demand for the 1995 NOGA results and the fact that it is the first, entirely digital, comprehensive oil and gas domestic assessment available, prompted CERT to develop a web site to deliver the oil and gas plays, cells, tables, and geologic reports to the public. NOGA Online includes an ArcIMS application that allows interactive viewing of the assessment data and results. CERT has begun the process of re-assessing oil and natural gas resources of priority basins in the United States. New assessment results will be made available at this site on an ongoing basis. The purpose of this document is to demonstrate the features and functionality of NOGA Online.
The U. S. Geological Survey (USGS) is a world leader in the natural sciences through our scientific excellence and responsiveness to society's needs. The USGS Energy Program serves the national interests of the United States by providing reliable scientific information that aids in the management of energy resources. Research is conducted to assess the energy resources of the US and the world. One of the major objectives of the Central Energy Resources Team (CERT) is to evaluate and develop science-based assessment methodologies and, using these methods, produce assessments of domestic oil, gas and coal resources.
In 1995, the USGS completed the National Assessment of Oil and Gas Resources. The purpose of this assessment was to scientifically estimate the amount of oil and gas that could be added to the proved reserves of the United States. This assessment consists of a set of conclusions based on the best information and theory available to the USGS for the onshore areas and beneath State waters. For this National Assessment, resources and potential reserve additions were evaluated regardless of political or economic considerations (Gautier, 1995).
The 1995 National Assessment of Oil and Gas Resources is the first comprehensive domestic assessment available in digital format; version 1 was published on CD-ROM in 1995; an updated CD-ROM (version 2) was released in 1996. Within the last year, CERT has made all 1995 NOGA data and geologic reports accessible on the Internet through the CERT web site. This paper will demonstrate the functionality of NOGA Online at http://energy.cr.usgs.gov/oilgas/noga. Users will learn how National Oil and Gas Assessment data can be retrieved from the Internet Map Application and other web pages. The terminology used in the 1995 National Oil and Gas Assessment and hence, at the NOGA Online website, is intended to represent standard definitions and usage of the oil and natural gas industry and the resource-assessment community. Given below is background information essential to understanding the assessments and the data provided at NOGA Online.
The onshore and State water areas of the United States comprise 71 provinces. Each of these provinces is defined geologically, and most province boundaries are defined by major geologic changes. The province, or basin, boundaries were drawn on the county lines that most closely followed the natural geologic boundaries. (http://certmapper.cr.usgs.gov/data/noga95/natl/spatial/doc/pr_natlg.htm).
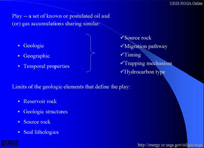
Within each province, the fundamental assessment unit used in the 1995 National Oil and Gas Assessment was the "play". A play is defined as a set of known or postulated oil and or gas accumulations sharing similar geologic, geographic, and temporal properties, such as source rock, migration pathways, timing, trapping mechanism, and hydrocarbon type (Gautier and others, 1996, fig. 1). The geographic limit of each play represents the limits of the geologic elements that define the play. The geologist responsible for each province defined and mapped the limits of the reservoir rock, geologic structures, source rock, and seal lithologies. The only exceptions to this are plays that border the Federal-State water boundary. In these cases, the Federal-State water boundary forms part of the play boundary.
Figure 1. Definition of an oil and (or) gas play
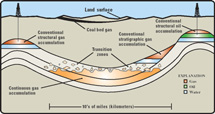
Undiscovered oil and gas resources include those postulated to exist outside known fields or accumulations that, if found, could be extracted using traditional development practices. These accumulations generally exist as discrete accumulations, called conventional accumulations, which are defined, controlled, or limited by hydrocarbon/water contacts (Gautier and others, 1996, fig. 2). Continuous-type (unconventional) accumulations are, for the purposes of the 1995 assessment, defined to include those oil and gas resources that exist as geographically extensive accumulations that generally lack well-defined oil/water or gas/water contacts (Gautier and others, 1996). Coal-bed gas is included in the continuous-type category.
Figure 2. Schematic diagram of the types of oil and gas resources assessed in the priority provinces of the U. S. Both conventional and continuous accumulations are assessed. Coal-bed gas is considered to be a continuous-type accumulation (from Schenk and Pollastro, 2002).
Estimates of undiscovered resources are presented as a range of values corresponding to probabilities of occurrence in order to express the uncertainty inherent in assessment of unknown quantities of oil and gas. The input variables of accumulation sizes and numbers are themselves expressed as probability functions. The resulting cumulative probability distributions represent the quantity of undiscovered resources; from these distributions, various fractiles, including the low (F95), the high (F05) and the mean estimates are obtained (Gautier and Dolton, 1995).
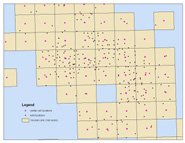
Cell maps for each oil and gas play were created by the USGS as a method for illustrating the degree of exploration, type of production, and distribution of production in a play or province (fig. 3). Each cell represents a quarter-mile square of the land surface, and the cells are coded to represent whether the wells included within the cell are predominantly oil-producing, gas-producing, both oil and gas-producing, or dry. The well information was initially retrieved from the Petroleum Information (PI) Well History Control System (WHCS), which is a proprietary, commercial database containing information for most oil and gas wells in the U.S. The present source of these data is the IHS Energy Group, Petroleum Information/Dwights Corporation.
Figure 3. Graphic description of the concept of cells representing proprietary wells
The program utilized to show well data as quarter-mile cells replaced the geographic coordinates of the wells with the appropriate cell-center coordinates. Each record represents the center of a cell where there has been oil and gas exploration and development. Each province geologist involved in the National Oil and Gas Assessment specified the stratigraphic intervals involved in each play. WHCS data were used to determine those cells that contained wells penetrating the specified stratigraphic interval and also to determine those cells producing from that interval.
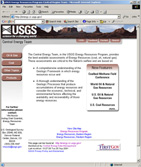
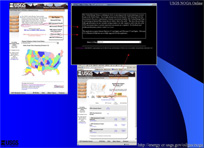
To get to NOGA Online visit the Central Energy Team website at http://energy.cr.usgs.gov (fig. 4).
Figure 4. USGS Central Energy Team Home Page
From the CERT homepage, there are several ways to navigate to NOGA Online, including the Oil & Gas button on the left and the link to U.S. Oil and Natural Gas Resources under New Features.
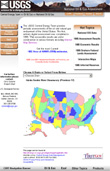
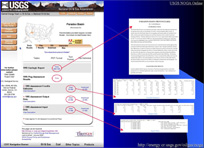
At the NOGA homepage (fig. 5), the assessment results data are provided by province (basin) from either a map interface or a pull-down menu. The province boundaries were drawn on the county lines that most closely follow natural geologic boundaries. Within these provinces, hydrocarbon plays are defined and assessed. The onshore and State water areas of the United States comprise 71 provinces. NOGA Online provides nearly 5000 datasets for viewing, downloading and interactive analysis.
Figure 5. The NOGA Home Page.
Once you reach a province or basin, navigation is through tabs and links associated with text. The Basin Results page (fig. 6) provides 1995 National Oil and Gas Assessment results by play and the province geologic report. Also available for viewing and download are the input data, the mean estimates, and the fractile estimates (probability distribution) from assessment of conventional undiscovered accumulations.
Figure 6. The Basin Results Page
The play assessment results can be viewed in tabular format (fig. 7). These are the same tables that were published by the USGS in 1995 on CD-ROM, USGS DDS-30 (Gautier and others, 1995).
Figure 7. The Play Results Page
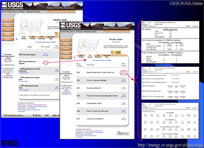
The play assessment results can be downloaded in shapefile or ArcInfo1
EXPORT format complete with FGDC-compliant metadata (fig. 8). GIS users can
download the data to use within a GIS program on their desktop computers, such
as ArcView 3.x1 or ArcGIS1. Fractile estimates
for oil, gas and natural gas liquids (NGL) are incorporated as attributes in
play shapefiles and coverages. Four metadata documents are available for each
province, each with province-specific information such as play names and numbers,
province bounding coordinates, etc. One metadata document describes the conventional
plays within the province; another describes all the continuous-type plays;
the third metadata document describes the cells within a province; the fourth
describes the provinces within the U.S. The metadata documents help customers
find our website and therefore our science, when they perform searches from
websites such as the USGS Home Page at http://www.usgs.gov/.
Figure 8. The GIS Download Page
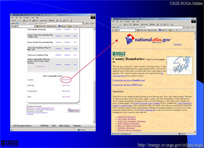
In addition to the plays, provinces and cells, some base-cartographic layers are included at the GIS Download page for reference and for overlaying layers of different data in a common geographic space within the Interactive Map Application (fig. 9). One of the primary layers included is surface ownership. The ownership layers we are providing are those that are being used for the Federal allocations being performed in accordance with Section 604 of the Energy Policy and Conservation Act of 2000 (EPCA). These ownership layers provide the snapshot in time of those data at the time they were downloaded for our studies. Data download and associated metadata are provided through links to the sources of the base cartographic layers.
Figure 9. The GIS Download page provides some base cartographic layers
included in the Interactive Map Application.
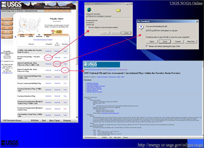
Users have an option of analyzing the assessment data via the Interactive Map Application developed using ArcIMS. The NOGA Online map application is a single interface that provides the following:
As of May, 2002, NOGA Online provides map services for 38 provinces (basins);
additional data from the 1995 Oil and Gas Assessment are being processed into
interactive map services and will be provided upon completion.
Migration to the Internet Map Application is provided from the NOGA homepage
and any of the province pages (fig. 10). Links to the Internet Map Application
open a page where the user can choose a map. The maps are provided by province
from a pull-down menu.
Figure 10. Migrating to the Internet Map Application
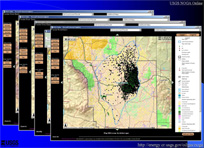
The Interactive Map Application (fig. 11) utilizes ArcIMS tools that allow the user to:
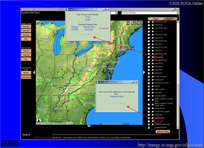
Figure 11. The Interactive Map Application using ArcIMS. These maps
demonstrate choosing layers and zooming in on the Upper Minnelusa Sandstone
play boundary and the cells within that play in the Powder River Basin Province,
Wyoming and Montana. Also shown are base cartographic layers including surface
ownership.
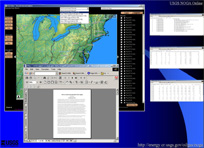
Within the map application, the user can access related information from drop-down
menus or open another map. By clicking on the 'Get Assessment Results' drop-down
menu (fig. 12), the user can view the geologic report and assessment results
tables within the map application (PDFs, text, or download tab-delimited files).
Figure 12. Accessing related information from the 'Get Assessment Results' drop-down menu within the Interactive Map Application
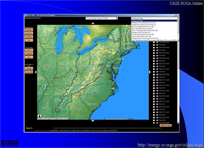
The 'Additional Maps' drop-down menu (fig. 13) provides a list of all the provinces
that are currently available as Internet Map Services. The user can link to
another province by selecting it from the list.
Figure 13. Accessing related information from the 'Additional Maps'
drop-down menu within the Interactive Map Application
Also provided are links to information associated with the layers, such as the
play assessment results mentioned above, GIS data, metadata, and links to the
sources of the base cartographic layers (fig. 14).
Figure 14. Accessing related information through links within the Interactive Map Application
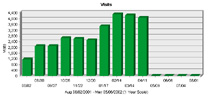
The usage statistics from August, 2001, to May, 2002, are as follows:
Figure 15. NOGA Online usage distribution, August, 2001, to May, 2002.
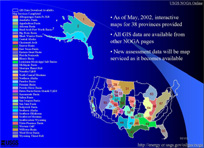
As previously mentioned, the ArcIMS map application is under development (fig.16). Current work includes providing consistent symbology and implementing the recent USGS Section 508 and Visual Identity requirements. National Oil and Gas Assessments are ongoing for priority provinces. For future NOGA assessments, modifications to NOGA Online will be made to further improve the distribution of scientific information, i.e., include additional geologic layers and links to graphical information, such as detailed cross sections linked to lines of section.
Figure 16. Summary of NOGA Online progress as of May, 2002.
As of May, 2002, interactive maps for 38 provinces are provided. Although information being map served is limited, all GIS data are available at the GIS download pages. Further data from the 1995 National Oil and Gas Assessment are being processed into interactive map services and will be provided upon completion. Additionally, new assessment data and information will be processed for interactive map services as it becomes available.
Some of the benefits of NOGA Online are:
All of the 1995 NOGA results are available on the WWW. Users were shown how
to access, download and view information from our website and internet map application.
Additional assessments will be included at this web site on an ongoing basis.
Any use of trade, product, or company names in this publication is for descriptive purposes only and does not imply endorsement by the U.S. Government.
This web implementation has been a group effort from the Data Management (DM),
Information Systems (IS) and National Oil and Gas Assessment (NOGA) projects
of CERT. We acknowledge the NOGA project chief, Christopher J. Schenk and the
DM / IS group leader, David A. Ferderer for their support in providing staff
and in purchasing the necessary hardware and software to implement this web
presence. We acknowledge all those USGS employees who contributed to the 1995
National Oil and Gas Assessment (U.S. Geological Survey National Oil and Gas
Resource Assessment Team, 1995). Without the contributions of many USGS employees
who helped automate such things as the metadata effort (Peter N. Schweitzer),
data rescue (Ronald R. Charpentier, Timothy R. Klett, Raymond C. Obuch), database
creation for attribution (Nick Zihlman), creation of map services (Steven M.
Dunn, Chris H. French, Sargent McDonald), symbolization of base layers (Larry
Backe, Steven M. Dunn), IT systems support (Cheryl W. Adkisson, James D. Brewton,
Christa Lopez, Raymond C. Obuch, Sean Strickland) and all those who are presently
assessing oil and gas resources of the U.S., (http://energy.cr.usgs.gov/oilgas/noga/staff.htm)
we would not be able to provide NOGA science over the internet.
Beeman, W. R., Obuch, R.C., and Brewton, J.D., compilers, 1996, Digital map data, text, and graphical images in support of the 1995 National Assessment of United States Oil and Gas Resources: U.S. Geological Survey Digital Data Series DDS-35, one CD-ROM http://greenwood.cr.usgs.gov/energy/PubsPgs/DDS-35.html.
Charpentier, R. R., Klett, T.R., Obuch, R.C., and Brewton, J.D., compilers, 1996, Tabular data, text, and graphical images in support of the 1995 National Assessment of United States Oil and Gas Resources: U.S. Geological Survey Digital Data Series DDS-36, one CD-ROM http://greenwood.cr.usgs.gov/energy/PubsPgs/DDS-36.html.
Gautier, D. L., 1995, A Summary of the U.S. Geological Survey 1995 National Assessment of Oil and Gas Resources: U.S. Geological Survey Fact Sheet, http://energy.usgs.gov/factsheets/NAresults/nat.assess.number.html.
Gautier, D. L., Dolton, G.L., Takahashi, K. I., and Varnes, K.L., 1996, 1995 National assessment of United States oil and gas resources; results, methodology, and supporting data: U.S. Geological Survey Digital Data Series DDS-30, Release 2, one CD-ROM http://greenwood.cr.usgs.gov/energy/PubsPgs/DDS-30.html.
Gautier, D. L., and Dolton, G.L., 1995, Methodology for assessment of undiscovered conventional accumulations, in Gautier, D. L., Dolton, G.I., Takahashi, K.T., and Varnes, K.L., eds., 1995 National assessment of United States oil and gas resources--Results, methodology, and supporting data: U.S. Geological Survey Digital Data Series DDS-30, one CD-ROM http://greenwood.cr.usgs.gov/energy/PubsPgs/DDS-30.html.
Schenk, C. J., and Pollastro, R. M., 2002, Natural Gas Production in the United States, U.S. Geological Survey Fact Sheet 0113-01 http://greenwood.cr.usgs.gov/pub/fact-sheets/fs-0113-01.
U.S. Geological Survey National Oil and Gas Resource Assessment Team, 1995, 1995 National Assessment of United States Oil and Gas Resources: U.S. Geological Survey Circular 1118, U.S. Government Printing Office, Washington, D.C., 20 p. http://greenwood.cr.usgs.gov/energy/circ1118.pdf.
Laura R. H. Biewick, GIS Coordinator
USGS - Central Energy Team
P.O. Box 25046, MS 939, DFC
Denver, CO 80225
phone: (303) 236-7773
fax: (303) 236-0459
email: lbiewick@usgs.gov
Gregory L. Gunther, Geographic Information Systems and Web Development
USGS - Central Energy Team
P.O. Box 25046, MS 939, DFC
Denver, CO 80225
Fax: 303.236.0459
Phone: 303.236.5884
ggunther@usgs.gov
Christopher C. Skinner, GIS Analyst and Programmer
USGS - Central Energy Team
P.O. Box 25046, MS 939, DFC
Denver, CO 80225
Fax: 303.236.0459
Phone: 303.236.1651
cskinner@usgs.gov