Gary L. Christopherson, Patrick Barabe, Peter S. Johnson
The Madaba Plains are located between Jordan's Capital, Amman, and the city of Madaba. The plains stretch from the deserts on the east to the sharp drop of the Rift Valley and the Dead Sea on the west. Archaeologically, the region contains a rich history of human settlement, with a number of major talls, and innumerable small sites.
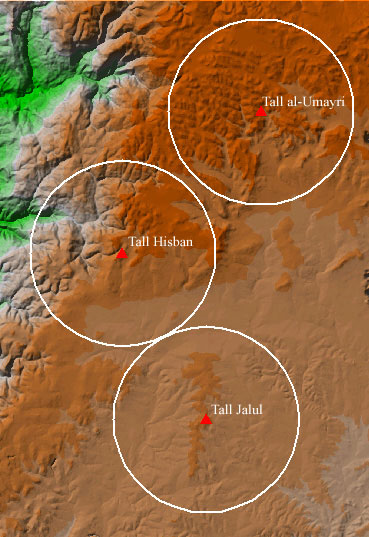
The Madaba Plains Project has been engaged in archaeological research in the region since 1968. They are currently conducting excavations and regional surveys at three sites in the region: Tall al-Umayri, Tall Jalul, and Tall Hisban (Figure 1). These three talls combine to provide a nearly continuous history of habitation in the region from the Early Bronze Age (2500 BC) to the Ottoman Period (1918 AD). Beyond this, material culture from the hinterlands around the talls push the history of humans in the region back to the Lower Palaeolithic (ca 500,000 BP).
This study will present data primarily from the survey carried out around Tall al-Umayri. Tall Umayri is a large fortified site that was occupied from the Early Bronze Age until sometime during the Persian Period (540-330 BC). During the Iron Age II (900-600 BC), it was an administrative and political center in the region. Along with its nearby contemporary site, Tall Jawa, Umayri provided an urban component to an otherwise rural area. The Umayri survey was conducted over four field seasons, between 1984 and 1992, within a five kilometer radius around Tall al-Umayri, documenting 133 antiquity sites. Of these 133 sites, 101 had evidence of occupation during the Iron Age II period. Most of the sites from this period consisted of constellations of agricultural features, such as small structures, winepresses, agricultural terraces, and a variety of field walls and rock-cut features. It is these Iron II sites that will provide the archaeological material for this paper.
One of the major emphases of the Umayri survey has been delineating relationships between sites. One aspect of such relationships are site catchments. An archaeological site catchment is an area of potential or actual resources, natural or human, exploited by a group. The size of the area varies according to the size of the site and the available resources, but is usually limited to a reasonable travel distance . Although the terminology comes right out of the natural sciences, catchments in archaeological terms are not usually defined by the natural world. They more precisely represent economic and political zones where ancient humans made their living. So larger sites will necessarily have larger catchments that usually include small sites. Small sites have smaller catchments that may include even smaller sites. What we have in the Umayri region are two larger talls, Tall al-Umayri and Tall Jawa, surrounded by several smaller, satellite sites. This study will use site catchments to examine the relationships between these sites; between the large and the small, the large and the large, and the small and the small.
Traditionally, site catchments have been determined in one of three ways: simple Euclidean distance, travel time, and natural boundaries. The natural boundary method determines catchment zones based on natural regions, such as a watershed, a mountain range, or a valley. This has the advantage of providing an easily defined survey boundary, and there are a number of archaeological surveys that have used this method to establish catchments. The main problem with this model is that it does not reflect social and economic boundaries. Since site catchments are really about socio-economic use areas, catchments based on natural boundaries are less a definition of site catchments than they are of archaeological survey boundaries.
Euclidean distance catchments are determined by placing a radius of predefined distance around a site. This method of determining site catchments is easy to do and provides simple boundaries for the archaeologist to follow. It is fairly common in Near Eastern archaeology and is the method employed by the Madaba Plains Project. Traditionally, a radius of 5,000 or 10,000 meters is used . The obvious problem with Euclidean distance models is that they do not take into account the natural terrain in determining site catchments. For example, if a site is bounded on the east by a flat plain and on the west by a steep descent, the true catchment of the site will likely extend farther onto the plain than it does down the steep descent.
In order to overcome the major deficiency of the Euclidean distance models, travel time catchments were developed. In this model, it isn't distance, but travel time that determines a catchment. Typically, a two-hour travel distance is used. This distance is determined by systematically walking for two hours from a site in a series of transects. Once enough transects have been walked, a catchment area can be delineated that reflects the two-hour travel time. The primary advantage that these models have over the Euclidean distance models is that they reflect the way people actually work; it is unlikely that a farmer will spend more than two hours walking to his farthest field. Unfortunately, defining travel time catchments is both time consuming and subjective. Distance based on travel time is subject to different stride length, different walking speeds, different weather, etc. Calculating the same catchment area 100 times would produce 100 different models. More problematic from a practical standpoint, this model requires a lot of time and effort to create. Walking the necessary transects can mean days or weeks of work, effectively eliminating the calculation of multiple catchments from all but the most long term projects. So although catchments based on travel time are probably the most accurate reflection of the true catchment of an archaeological site, they are the least commonly used because they are the most difficult to determine.
This study seeks to overcome the difficulty of travel time models by using ARC GRID's PATHDISTANCE function to calculate travel cost for archaeological sites. Many of the things archaeologists look for when calculating a site’s catchment are included in GRID’s PATHDISTANCE function. Much like the travel time models, pathdistance models measure cost units across a surface, rather than distance, to calculate a least accumulative cost surface from a point location or locations. Included in this cost measurement are surface distance and impedance factors. Additionally, archaeologists will be happy to discover that once the base data layers have been developed, pathdistance catchment models can be calculated in a matter of minutes, compared to the days or weeks for traditional travel distance maps. This makes it realistically possible to build catchment models for multiple sites.
The requirements for the PATHDISTANCE function in GRID typically include the following grids: a digital elevation model (DEM), a cost surface, and a grid containing a target location or locations. The target locations (or source grid) are the cells in the study area from which the least-accumulative-cost surface is calculated. For this study, the target locations varied depending on the questions being asked. In the single site model, this grid contained a point representing Tall al-Umayri. In the twin site model it contained points for Tall al-Umayri and Tall Jawa. For the multi site model, it contained points for all sites with Iron Age II pottery.
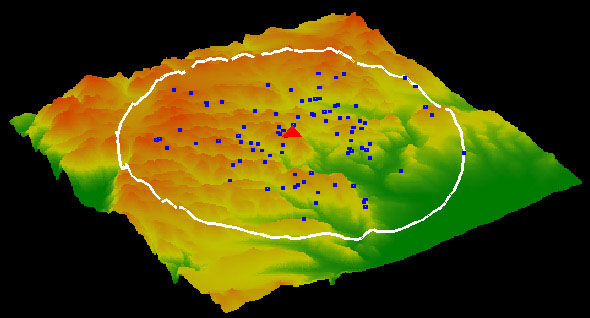
The pathdistance model differs from simpler models in that it incorporates a z-value for calculating true distance traveled. This difference is important; by incorporating elevation values from a DEM it becomes possible to more accurately determine the effort or energy needed to traverse a surface. Calculating surface distance is simple geometry. PATHDISTANCE produces a right triangle for each cell in the raster whose base equals the length of the cell. The height equals the elevation of the from cell minus the elevation value of the to cell. The surface distance then is defined by the third side of the right triangle, calculated using the Pythagorean theorem (a2 + b2 = c2). The DEM used in this study had a cell resolution of 20 meters and was created using GRID's TOPOGRID command Contour and drainage data were taken from 1:25,000 maps . A three dimensional view of this DEM overlaid by Iron Age II sites and survey boundary can be seen in Figure 2.
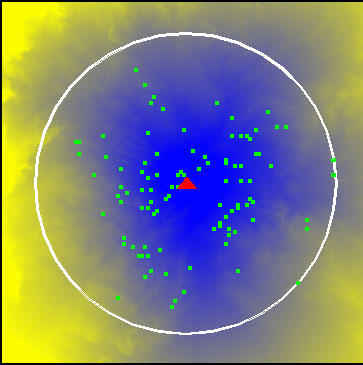
The cost grid is a raster surface defining the impedance, or cost to move planimetrically through each cell. The cost grid is generally used to account for factors such as slope, stream channels, roads, and prevailing winds. For this study the cost grid was created from two variables, wadi channels and slope. The wadi channels were ordered based on the Strahler method whereby stream order increases only when streams of the same order intersect. Therefore the intersection of a first order and second order link will remain a second order link rather than create a third order link. Under this system, stream order in the study area ranged from one to five. The other variable used in the creation of this surface was the slope of terrain in the study area. Based loosely on U.S. Forest Service guidelines , slope values in the Tall Umayri area were divided into four classes. The first class consisted of values ranging from zero to five percent slope. These cells were then given a cost value of one. The next class contained slope values ranging from five to fifteen percent, and were assigned a cost value of two. The third slope classification was composed of values extending from fifteen to thirty percent and given a cost value of four. The last category had slopes of 30 percent or greater, and was assigned a cost value of sixteen. This last slope category (30% and above) was given a large cost value to indicate that these areas had such steep slopes that they became functionally impassable to all but the most determined hiker. Adding together the derived wadi channel and categorized slope maps created the cost surface seen in Figure 3. In this surface, as in all models found in this document, blues are low values and yellows are high values.
Having constructed the components for calculating pathdistance surfaces, creating site catchment models was quickly accomplished. In the remainder of this paper, three examples of the types of analyses made possible by pathdistance catchments will be discussed.
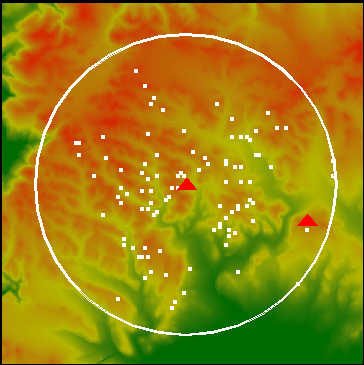
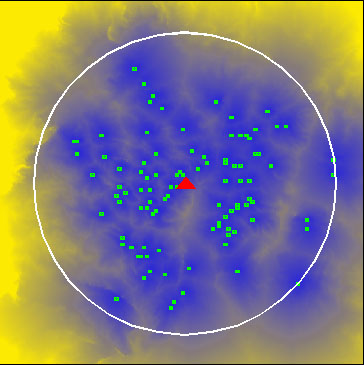
The first catchment model built was intended to examine the relationship between Tall al-Umayri and all Iron Age II sites within the five kilometer survey radius. The question we were attempting to answer was whether or not travel cost from Tall Umayri as was an important factor in Iron Age II settlement patterns. Figure 4 shows the pathdistance catchment model with the locations of Iron Age II sites. A simple visual examination of the image suggests that the sites tend to be located in the areas of lower value and away from the yellow, higher cost areas. Summary statistics in Table 1 support this perception, with the mean cost value for sites in the project region 1350 units less than that of the project region as a whole.
| Project Region | Iron Age II Sites | |
| Mean | 6015.791 | 4665.009 |
| Std. Dev. | 1969.208 | 1728.792 |
| Min | 0 | 1014.726 |
| Max | 11231.898 | 8784.478 |
In order to test the validity of these summary observations,
this pathdistance catchment model was queried by the Iron Age
II site locations, and by a random sample of points within the
5 kilometer survey region. These samples were then subjected to
a Kolmogorov-Smirnov goodness of fit test. This is a non-parametric
statistical test that measures the difference between the cumulative
proportions of two samples . As illustrated in Figure
5, it determines the point at which the two samples exhibit
the greatest difference in cumulative proportion, in this case
at a pathdistance value between 4500 and 5000. This maximum difference
between the two samples is the test statistic. Significance with
95% confidence is established if the difference between the samples
is greater than ![]() , where d is the maximum
difference between samples, and n is the sample size. Because
the square root of n serves as the denominator in this
equation, sample size greatly affects the point at which the difference
between the samples becomes significant . For the 100 Iron Age
II sites in this study, the difference must be greater than
, where d is the maximum
difference between samples, and n is the sample size. Because
the square root of n serves as the denominator in this
equation, sample size greatly affects the point at which the difference
between the samples becomes significant . For the 100 Iron Age
II sites in this study, the difference must be greater than ![]() in order to be significant. The actual difference,
0.328, indicates that pathdistance was an important factor in
settlement strategies during Iron Age II.
in order to be significant. The actual difference,
0.328, indicates that pathdistance was an important factor in
settlement strategies during Iron Age II.
The graph in Figure 5 also provides details about the type of preference exhibited in the settlement pattern. Because the cumulative proportion for Iron Age II sites is to the left of the random sample, it indicates that they preferred lower values than would be expected if the site selection process were random. This answers our first question about the relationship between Umayri and her satellite sites, and indicates that there are advantages to GIRD's PATHDISTANCE function to model site catchments.
The second example of pathdistance catchments was an examination of the two urban centers in the region, Tall al-Umayri and Tall Jawa. The analysis examined whether or not it was possible to use pathdistance to discover catchments for competing central places. Pathdistance catchments were created using these two talls as the target locations. The area we were interested in was a line of satellite sites between the talls (Figure 6). One option in the PATHDISTANCE function creates a backlink grid. This grid "identifies for each cell which cell to move or flow into on its way back to the source from which it is least costly to reach." This means that for any cell in the backlink grid, it will flow to target cell with the least accumulated cost.
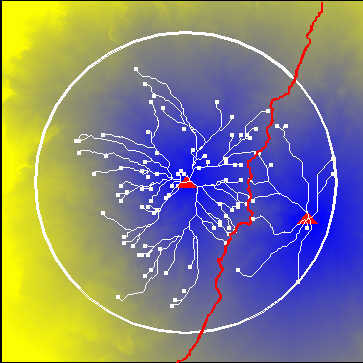
Using the backlink grid, in combination with the pathdistance grid and a grid with the locations of Iron Age II sites in the region, the GRID function COSTPATH created a grid which indicated the least accumulated path for each Iron Age II site. This grid can be seen in Figure 7 where the Iron Age II sites and the least accumulative path for each site overlay the pathdistance catchments for the talls. Examination of this image indicates that most of these points were actually associated with Tall Umayri. This answers our second question, that pathdistance catchments can be used to discover relationships between mother and daughter sites.
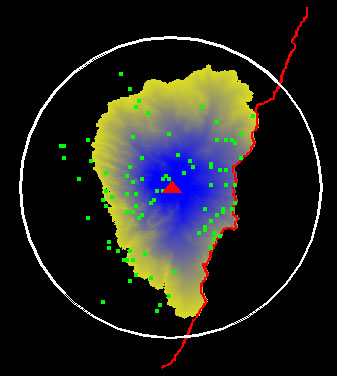
An important bonus also came out of this analysis. Not only did these catchments discover relationships between mother and daughter sites, they also suggested the maximum size of the Umayri catchment. The red line in Figure 7 illustrates the border formed by the pathdistance catchments for the two talls. Using the mean pathdistance value of this border, 5944 cost units, an absolute catchment zone was calculated for Tall al-Umayri. Seen in Figure 8, this catchment covered only 38% of the surveyed area, yet contained 81% of the Iron Age II sites not contained in Jawa's catchment.
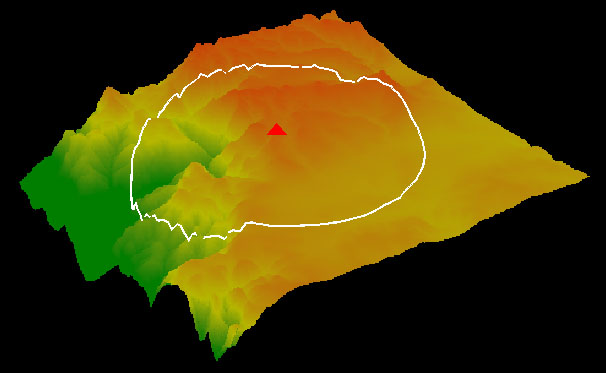
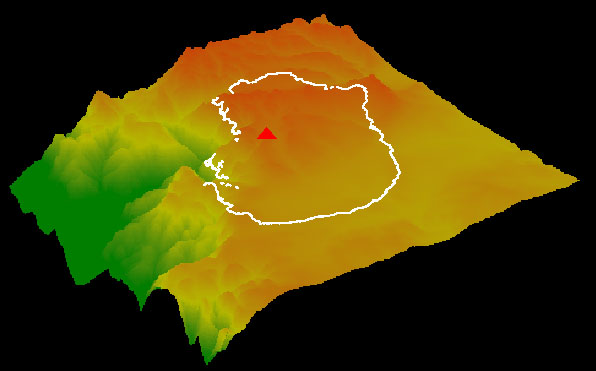
Transferal of this catchment based on 5944 cost units to another of the MPP survey regions produced interesting results. In the Hisban region, there is a clear demarcation between the flat plain stretching out to the southeast and the steep descent to the northwest. Seen in Figure 9, the five-kilometer Euclidean distance catchment is clearly not reflective of the region's landscape. More realistic is the pathdistance catchment based on 5944 cost units in Figure 10. This catchment stretches out nearly 5000 meters to the southeast, but only a few hundred meters to the northwest, providing a catchment for Tall Hisban that better fit the terrain.
The final example in this study was a multiple site pathdistance catchment model. This example focused on examining catchments around small sites as a way of discovering social relationships affecting settlement patterns. Assuming that travel between sites was important for a variety of reasons, such as economic exchange and the maintenance of social relationships, and assuming that interaction was most likely to occur between proximal sites, it was hypothesized that there would be a tendency for sites to be located closer to one another.
GRID's PATHDISTANCE function provided an easy means of investigating this relationship. Testing the above hypothesis was a three step process: 1) the creation of a nearest neighbor pathdistance model; 2) the querying of this model by the sites used in its creation and by a set of random point locations; and 3) a statistical test to determine if differences between the site and random samples were significant.
Step One: Pathdistance catchment models were created for all Iron Age II sites. Seen in Figure 11, this grid represents a nearest neighbor pathdistance model. Although this model worked fine when queried by the random sample, it was problematic for the site sample. The problem was that at each site location in this model, we get the distance of that site to itself, not to its nearest neighbor. To overcome this difficulty, an AML was written that would remove a single site from the site sample, create a multi-site pathdistance model, determine the value at the location of the site removed, and write this value out to a new grid. The process was then repeated for each site in the study until all were completed. Figure 12 is a graphic representation of this process. The end result was a grid with 100 points whose values represented the cost units to its nearest pathdistance neighbor; all other cells had a value of zero.
Step Two: Nearest neighbor pathdistance values were queried with the Iron Age II site grid to produce an ASCII text file with those values. Likewise, a pathdistance surface, created using all sites as source locations, was queried by a sample of randomly located points to produce an ASCII file containing pathdistance values to the nearest Iron Age II site. Summary statistics in Table 2 suggest that there was a relationship between sites.
| Random Sample | Iron Age II Sites | |
| Mean | 1124.09 | 704.69 |
| Std. Dev. | 193.66 | 442.40 |
| Min | 0 | 130.01 |
| Max | 3159.77 | 2605.31 |
Step Three: To test this, the site sample and random sample were subjected to a Kolmogorov-Smirnov test. As noted above, for our sample of 100 Iron Age II sites, the difference between samples must be greater than 0.136 in order to be significant at the 5% level. The actual difference between samples was 0.366, suggesting that travel cost between sites was an important factor in site location. As can be seen in Figure 13, the cumulative proportion for the site sample had lower values than that of the randomly located points, i.e. it is to the left of the random distribution, indicating that sites were closer to each other than would be expected if the site selection process were random. This supports the hypothesis that there would be a preference for proximity to other sites during Iron Age II.
This paper has demonstrated that models based on GRID's PATHDISTANCE function allow catchment-based analysis of archaeological sites on several levels. Several conclusions can be drawn from the three analyses highlighted in this study. The following are offered here as a summary.
Christopherson, Gary L., and D. Phillip Guertin, Geographic Information Systems and Cultural Factors in Settlement Strategies. Paper presented at Annual Meetings of the American Schools of Oriental Research, New Orleans. Unpublished, 1996. http://www.casa.arizona.edu/MPP/viewshed/vspaper.html
D. Survey, Amman. War Office and Air Ministry, Amman, Jordan, 1958a.
D. Survey, Naur. War Office and Air Ministry, Amman, Jordan, 1958b.
Esri, ARC/INFO. Environmental Systems Research Institute, Redlands, CA, 1998.
Ibach, Robert D., Archaeological Survey of the Hesban Region: Catalogue of Sites and Characterization of Periods. Andrews University/Institute of Archaeology, Berrien Springs, Michigan, 1987.
Kvamme, Kenneth L., One-Sample Tests in Regional Archaeological Analysis: New Possibilities Through Computer Technology. American Antiquity 55:367-381, 1990.
LaBianca, Øystein S., Introduction to the Hinterland Survey. In Madaba Plains Project 1: The 1984 Season at Tell el-Umeiri and Vicinity and Subsequent Studies, edited by Lawrence T. Geraty, Larry G. Herr, Øystein S. LaBianca, and Randall W. Younker, pp. 23-26. Andrews University/Institute of Archaeology, Berrien Springs, Michigan, 1989.
Purdy, Barbara A., How to do archaeology the right way. University Press of Florida, Gainesville, Fla, 1996.
United States Forest Service, Trails management handbook. Forest Service handbook ; 2309.18. Dept. of Agriculture Forest Service, Washington DC, 1991.
Vita-Finzi, Claudio, Archaeological sites in their setting. Thames and Hudson, London, 1978.
Vita-Finzi, C., and E. S. Higgs, Prehistoric Economy in the Mount Carmel Area of Palestine: Site Catchment Analysis. Proceedings of the Prehistoric Society XXXVI:1-37, 1970.
Gary L. Christopherson is the director of the Center for Applied Spatial Analysis (CASA) at The University of Arizona. CASA is a research unit specializing in geographic information systems (GIS) technologies in the College of Social and Behavioral Sciences. He has been associated with the Madaba Plains Project since 1987, where he is a Field Director in charge of archaeological survey. Correspondence may be sent to: CASA, Harvill 460, The University of Arizona, Tucson, AZ, 85721, phone (520) 621-6267, or by email: garych@casa.arizona.edu
Patrick Barabe is a graduate student in Geography at the University of Arizona. He is a research assistant at the Center for Applied Spatial Analysis (CASA) at the University of Arizona, as well as at the Bureau of Applied Research in Anthropology. Patrick specializes in the use of geographic information systems in the social sciences. Correspondence may be sent to: CASA, Harvill 460, The University of Arizona, Tucson, AZ, 85721, phone (520) 621-6267, or by email: pbarabe@casa.arizona.edu
Peter S. Johnson is a masters candidate in the Department of Geography and Regional Development and a Research Assistant at the Center for Applied Spatial Analysis (CASA) at The University of Arizona.Correspondence may be sent to: CASA, Harvill 460, The University of Arizona, Tucson, AZ, 85721, phone (520) 621-6267, or by email: peter@casa.arizona.com