Role of GIS in the Project
Collaboration on an interdisciplinary project integrating GIS was the goal
of the two GIS teachers and the university professor specializing in geography.We
decided to use GIS to show change over time by creating GIS models of Southeast
Raleigh in the 1800’s, 1950, 1960, 1970, and today. We anticipated that
the models would show the area's growth, cultural features, and an environmental
component that would show the decrease in vegetation with the growth of
the city. As life in the south was rigidly segregated at this time, we
wondered about the separate life spaces that would emerge from spatial
analysis of the alumni's activities.
As the project evolved to include other partners with diverse interests,
the GIS focus shifted to historical documentation of the African American
perspective of life during Ligon High School's pre- and Civil Rights era;
1953-1971. We realized that the original scope of the project was unrealistic.
It became apparent that the Ligon attendance district encompassed not just
Southeast Raleigh, but the entire city of Raleigh, and that the data we
needed to do the project was not readily available. Hagevik questioned
the appropriateness of including GIS in this project. "What would GIS contribute
that is unique?" she challenged. As the project evolved further, GIS became
the framework for other aspects of the project.

|
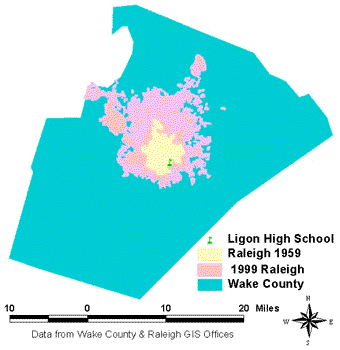
Annexation data layers demonstrate the growth of Raleigh from its origins
to its current boundaries and the location of Raleigh within Wake County.
Ligon High School served all Black students in the Raleigh City School
System, thus its attendance boundaries are represented by the 1959 city
limits. Ligon High School had a reputation for excellence in academics
and the arts. The sports teams had a statewide reputation as champions
of the Black conferences. Ligon was a source of pride and the center of
the Black community. During desegregation, the Raleigh City School System
merged with the Wake County School System. Redistricting by busing forced
Black students into schools far away from their homes in order to satisfy
federal orders. Students who felt loved and nurtured by the community in
their school became minorities left to fend for themselves in environments
that they reported often seemed hostile and impersonal to them. The GIS
model vividly demonstrates the spatial dimensions of this Diaspora. |
In our discussion of how GIS could help to tell the Ligon story, it
became apparent that "official" layers of information could tell only part
of the story. "Official" data was limited to interests of the city, county,
state and federal polities, and we were trying to tell a story from the
perspective of the African American community. Too often, from the perspectives
of "official" layers, the African American spaces in the city were viewed
as expendable, divisible, and unsuitable for preservation or redevelopment.
These neighborhoods had become subject to division by highways that fragmented
the community by effectively creating barriers both around and through
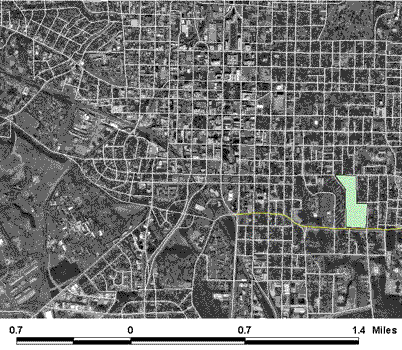
it. (DOQQ below and Hawkins, personal communication)

|
Adding additional lanes to Smithfield Street (shown in yellow) created
an east-west artery, Martin Luther King Boulevard, just south of Ligon
(shown in green). This improved traffic problems but divided the African
American neighborhood. |
Because official data was unavailable, the memories of alumni provided
much of the information necessary to create the data layers. Journalism
students collected information during interviews. From videotapes of the
interviews, GIS students listed locations along the routes walked to and
from LHS. To get more specific geographic information, GIS students used
Local
Schools, Exploring Their History (1986) as a guide to generate a bank
of geographic questions. Using these questions they interviewed two alumni.
During the interviews students constructed the alumni's life maps using
paper maps of Wake County and the city of Raleigh. Constructing these maps
generated more specific geographic questions for the alumni. Videotapes
of the interviews were used to verify answers to the geographic questions.
The Wake County Heritage students researched and produced a list of
buildings important to Ligon High School's history. GIS students did research
in history books written from an African American perspective, especially
Culture
Town by Linda Simmons-Henry who later joined the partnership. Graduate
students contributed data from research at the State of North Carolina
Archives, the NCSU Archives, the Saint Augustine’s College Archives, the
Southern History Collection at the University of North Carolina at Chapel
Hill, Richard B. Harrison Library, Olivia Raney Library, Washington Elementary
GT Magnet School, and the Historic Preservation Society. This information
was also used as the basis for Mr.
Hunter's biography published on the Ligon High History web site.
Base layers for the GIS including annexation, Wake County Streets, downtown
and Southeast Raleigh land parcels were provided by the Raleigh GIS office.
Wake County GIS provided data including census tracts and public schools.
The USGS provided the DOQQ's of Wake County. TIGER-95 county street layer
data would not overlay with the DOQQ. NCSU GIS reference librarian revealed
that this is a common problem with this type of data in our area. The original
data came in a variety of projections and map units: annexation, State
Plane 27 (feet); land parcels and county streets, State Plane 83 (meters);
census tracts and public schools were DXF files. All files were converted
to UTM 83 zone 17 (meters) to be compatible to the DOQQ's of Wake County.
GIS Graduate student Irvin Vann assisted Ann Thompson with the identification
of the original projections and reprojection. New themes were added for
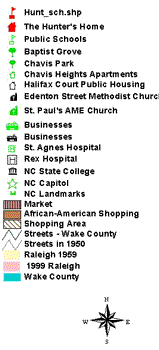
information drawn from research. Color coding was used to visually represent
segregated areas. Hotlinks were created to pictures from the State of North
Carolina Archives collection.
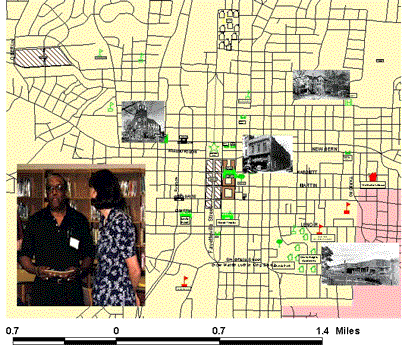
Mr. Hunter's Life Map of the 1950's
What emerged from the project was a prototype life map; an historic
representation of the alumnus' life space from his memories verified by
the memories of others. We hope that this kind of model can provide a useful
method for representing:
-
Comparative spatial interactions of cultural groups
-
Alternative "layers" of information that can be used to illustrate multiple
spatial perspectives
-
Archival documentation that can be used to validate the African American
experience
-
Identification of landmarks for historic preservation to guide redevelopment
In understanding how to represent these perspectives, the work of John
Pickles (1995), Kemp & Brooke (1995), and Harris, Weiner, Warner &
Levin (1995) were very helpful. These raised issues about layers
of information constructed by the state in comparison to information constructed
by indigenous and under-represented people. These provided models for conducting
interviews and resource mapping that we used to gather information relevant
to the African American community.
GIS provided a dynamic medium for communication. Alumni were able to
view their history from a new perspective and were able to interact with
it. People can access varying combinations of data according to their needs
and interests. This GIS project will continue to evolve drawing energy
from the enthusiasm of the alumni, middle school students, and facilitators.
We now approach the task aware of the obstacles, realizing that we must
glean information from research and interviews to create new data layers
that represent African American history.
|
Observations on the interaction of GIS graduate student Irvin
Vann with the GIS class:
Vann offered technical assistance to the GIS students and teachers.
He taught Thompson and two students to geocode the street layer, query,
and troubleshoot finding addresses. "The students had basic knowledge of
using the ArcView environment so I only guided them through an unfamiliar
aspect of the software." (Vann, personal communication) He consulted with
one middle school student on his GIS project that shows the development
of railroads in North Carolina and their influence on population growth
of the state. the student had used scanned historical maps as a base and
created new themes to show the railroads. Michael was using the "union"
data feature to join separate sections of railroads, which caused all sections
of the railroad at the junctions to share attributes. Vann taught him to
use "snapping" so the separate sections of railroads could be joined appropriately
and maintain thier unique attributes.
'The students were very enthusiastic and they knew the basics of the
ArcView environment well. Many times I was only giving them the benefit
of experience rather than teaching them something brand new. They had good
ideas on what they wanted to do but were not really sure how to do it.
For example, in the story about the railroad layer one of my main contributions
was to teach the student the value of the ArcView help features by sharing
my approach to his problem.
This class made the most use of the query and display features of ArcView.
Additionally they recreated a school alumni's life map using a present
day street map to look at areas around their school that were important
in the life of this alumnus. The class also looked at the evolution of
Raleigh by using data provided by the city GIS services. The students created
a display of city growth by displaying all annexation parcels from the
founding of the city. So, the students made excellent use of public information
to look at their world.
Students who begin in middle school to look at world around them using
a GIS will obviously ask the tough questions of the future. They will be
the users of the incredible amounts of georeferenced data that is being
collected by public agencies and made available on the World Wide Web.
As future citizens they will mature in their GIS skills by creating new
information based on the relationships of the data and applying it to solve
problems." (Vann, personal communication)
|
Return to Exploring the Past to Influence the
Future
Background Information about the School | School
Connecting to the Alumni | School Connecting with
the Community
Background on the Collaboration | Community
Connecting with the School | Connecting Students
with Community Partners
Sharing the Project Products | How
did students benefit from the project?
...To Guide the Future


